November 2020 Economic Outlook
The CoreLogic Home Price index has reported quickening appreciation in home values since May, and in September annual price growth was more than two percentage points faster than one year earlier. The acceleration in price growth reflected a demand and supply imbalance. Record-low mortgage rates stimulated demand: Millennials and Gen Xers saw the opportunity to be either first-time or trade-up buyers. Concurrently, the pandemic contributed to an acute supply shortage: Warnings that older Americans were at greater health risk coupled with shelter-in-place restrictions prompted some older prospective sellers to defer their listing. But will summer’s increasing price growth continue in the autumn?
A partial answer is found looking at pending sales. The pending sales contract is typically made 30 to 45 days before closing of the transaction. The price information in the sales contract provides a window into what we should expect to eventually see in a traditional price index, which is based on closed sales.

© 2020 CoreLogic, Inc., All rights reserved.
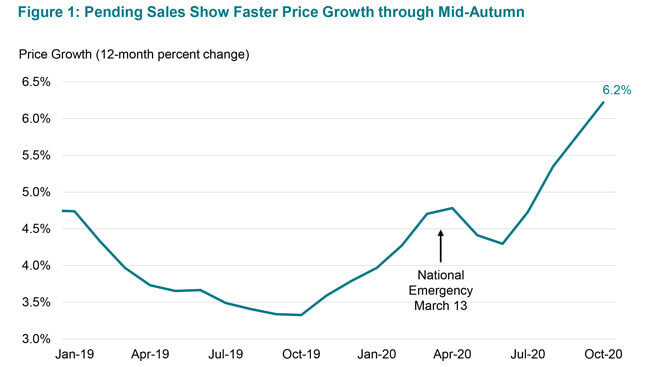
Using pending sales through September from the CoreLogic Multiple Listing Service, we can construct a home-price metric that provides a good prediction of home-price trends through mid-autumn. Our Pending Home Price Index finds that annual price growth will continue to quicken. (Figure 1) Based on a composite index covering 20 metros, we find annual price growth continuing to accelerate in October at the fastest pace in more than two years.

© 2020 CoreLogic, Inc., All rights reserved.
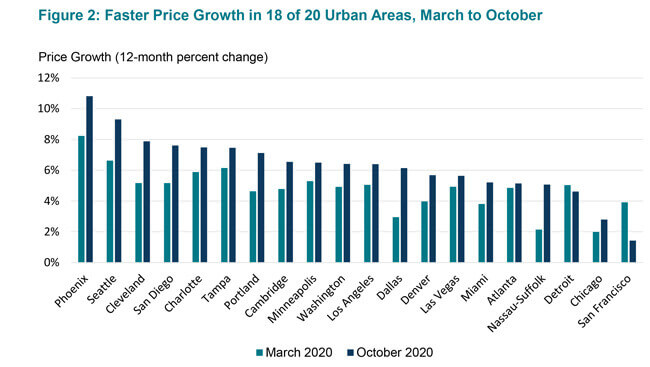
Across these 20 urban markets, annual price growth has increased since March in all but two cities. (Figure 2) Only Detroit and San Francisco had slower price growth, with annual price growth easing to about 1% in San Francisco. Dallas has had the biggest jump in annual price gain, doubling to 6% growth in October. In Phoenix and Seattle, which already had above average annual appreciation before the pandemic, annual price growth has accelerated to near 10%.
Our analysis of pending sales indicates that price growth will remain strong and increase in most markets though mid-autumn. But in 2021, as pandemic worries recede and more inventory is listed for sale, the CoreLogic forecast has a slowing in home-price growth.
Summary:
- CoreLogic HPI annual growth has quickened since May.
- Pending sales provide insight for next month’s price growth.
- Pending HPI shows that annual growth continues to increase through October.
- In 18 of 20 metros, annual price growth increase from March to October.
- CoreLogic HPI Forecast predicts a slowing of growth in 2021.
© 2020 CoreLogic, Inc. All rights reserved.
Get the CoreLogic Economic Outlook for November 2020 on YouTube. Each month, CoreLogic Chief Economist Dr. Frank Nothaft will provide data driven analysis for the economy and property industry. For more insights, subscribe to our YouTube channel.
Note: Bin He created the Pending HPI and the exhibits shown in this blog. Additional information on the Pending HPI can be found here.


