Jumbo-Conforming Mortgage Rate Spread Reaches the Pre-Pandemic Level
Historically, large-balance mortgage loans, known as ‘jumbo’ loans, have had a higher interest rate than conforming loans.[1] However, since mid-2013, the interest rate for a jumbo loan was lower than a conforming loan until June 2020. Low interest rates during the pandemic didn’t benefit homebuyers with jumbo loans the same way as it did homebuyers with conforming loans. While the conforming mortgage interest rate dropped to record lows in 2020, the jumbo-to-conforming mortgage rate spread widened and jumbo loans became relatively more expensive than conforming loans. As confidence in the housing market and the economy improved in 2021, the difference between jumbo and conforming mortgage interest rates narrowed.
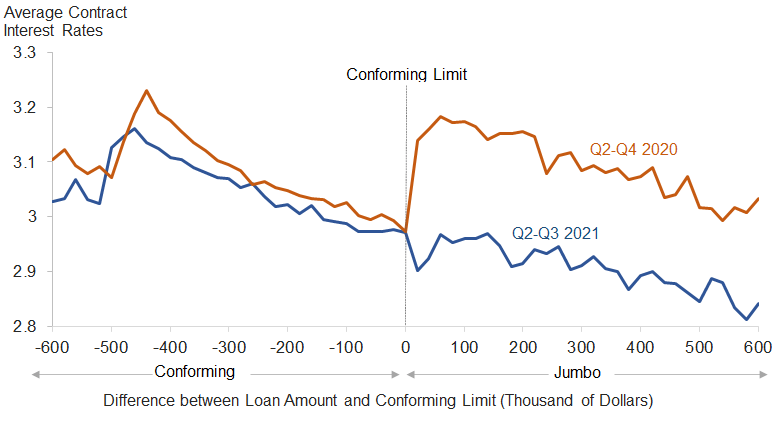
Figure 1 plots the average interest rate for the loans that were originated in the second and third quarters of 2021 (Q2-Q3 2021) and April through December of 2020 (Q2-Q4 2020) as a function of the difference between the loan amount and the local-market conforming loan limit.[2] For loans originated in 2021, the local-market conforming loan limit (black vertical line) for one-unit properties for most areas was $548,250, with higher limits of up to $822,375 in areas designated as high cost.[3] Note that the chart shows an inverse relationship between the interest rate and the loan origination amount. The general trend reflects various fixed-costs of loan origination; in other words, the fixed-cost per loan size declines as the loan size increases.
In Q2-Q4 2020 (orange line), the interest rates gradually declined with the loan amount until the conforming loan limit is reached (black vertical line). However, for loans that exceeded the conforming loan limits, the rates jumped a sharp 17 basis points (bps) before declining again.[4]
The trend of mortgage interest rates spiking above the conforming loan limit observed during the pandemic reversed in Q2-Q3 2021, making the jumbo loan once again less expensive to borrow. The blue line in Figure 1 shows that interest rates in Q2-Q3 2021 continued to decline gradually regardless if the loan amount exceeded the conforming loan limit.
Figure 1: Average Interest Rates and Loan Amount: Q2-Q4 2020 and Q2-Q3 2021
(Conventional 30-Year Fixed-Rate Home Purchase Loans)

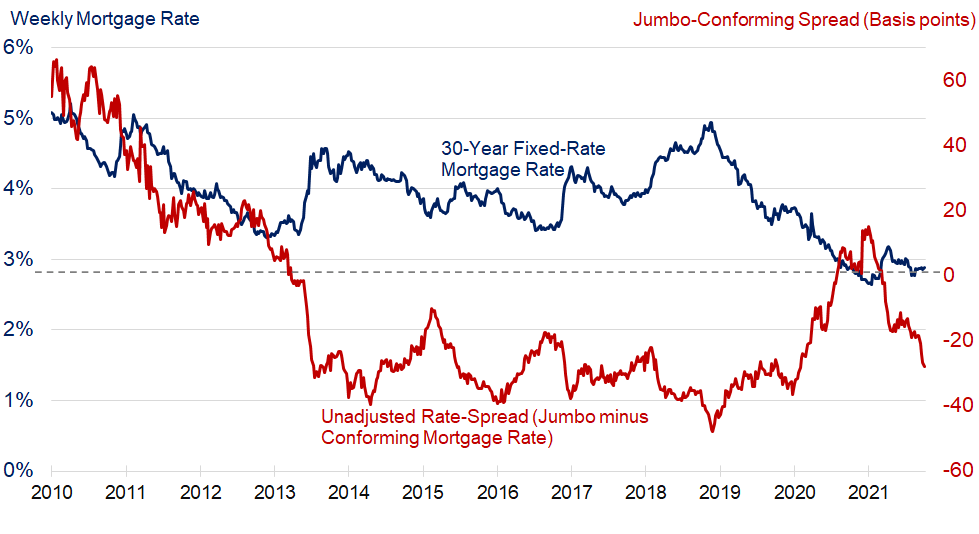
Figure 2 shows the weekly time series since 2010 of the interest rates for 30-year conventional conforming fixed-rate mortgages (the blue curve) and the unadjusted rate spread between jumbo loans and conforming loans (the red curve). The unadjusted rate spread is the difference between the interest rate of jumbo loans and conforming loans, without controlling for credit risk factors, property state, upfront fees or points. Before 2013, interest rates for jumbo loans were higher than for conforming loans; this is shown by the rate-spread being greater than zero. When the unadjusted rate spread drops below zero, this indicates that jumbo loans have a lower interest rate; if the unadjusted rate spread moves above zero, this indicates conforming loans are less expensive.
Movement in interest rates alone may help explain some of the variation in the jumbo-conforming spread, especially since 2013.[5] Figure 2 shows that the mortgage interest rate and the jumbo-conforming rate spread are inversely correlated. For example, as the mortgage interest rate dropped during the pandemic, the spread increased. Mortgage credit risk went up more for jumbo loans than conforming loans. Due to the heightened risk, jumbo loans became more costly to borrow in this period. However, as the mortgage interest rate started to inch up in early 2021, the unadjusted spread gap narrowed slightly. Though the mortgage interest rate has been flat in the last two quarters, the spread has narrowed and is a negative 27 bps. In other words, jumbo loans were less expensive than conforming loans by 27 bps.
Figure 2: Mortgage Rate (30-Year Fixed-Rate) versus Jumbo-Conforming Rate Spread
Correlation Coefficient: -0.8 (April 2013 – September 2021)

The jumbo-conforming spread may have been influenced by the lower credit risk attributes of jumbo loan borrowers and risk-based pricing and differences in scale economies and property location.[6] Figure 3 plots the adjusted jumbo-conforming spread after controlling for these attributes.[7] The overall pattern of adjusted spread followed the pattern of unadjusted spread.
The adjusted estimates show that the spread increased from -18 bps (with no adjustments for differences in attributes as shown in Figure 2) to 3 bps for the adjusted estimate in Q3 2021. In other words, during Q3 2021 the average contract rate on jumbo mortgages appeared to be 18 bps lower than for conforming mortgages, but after controlling for loan, borrower and property location differences, the average interest rate on jumbo mortgages was 3 bps higher than for conforming mortgages. The adjusted spread narrowed by 26 bps from Q3 2020 to Q3 2021. The Q4 2020’s mortgage rate spread was the highest since Q1 2013.
Figure 3: Adjusted Quarterly Jumbo-Conforming Spread Estimates, 2001 Q1-2021 Q3
(Adjusted Average: For 2013 – 2019 was -4 bps, 2020 was 18 bps, and 2021 was 8 bps)
(A Negative Spread Means Jumbo is Less Expensive)

As the economy continued to recover in 2021 the adjusted spread in Q3 2021 declined to the Q1 2020 level and was the lowest since the onset of the pandemic. With the forecast of an improving economy and further increases in long-term interest rates, the jumbo-conforming spread is likely to narrow further and jumbo interest rates may once again dip below conforming rates. The drop in the jumbo-conforming spread in 2021 may have been a factor in increased demand for jumbo loans. In an upcoming blog, CoreLogic will present the trend in the jumbo share of mortgage originations.
2022 CoreLogic, Inc. , All rights reserved.
[1] Jumbo loans have a loan amount that is higher than the conforming loan limits set by the Federal Housing Finance Agency.
[2] Only 30-year fixed-rate conventional home-purchase loans were included for both conforming mortgage loans and jumbo mortgage loans for this analysis.
[3] The 2020 maximum conforming loan limit for one-unit properties for most areas was $510,400, with higher limits of up to $765,600 in high-cost areas.
[4] A basis point equals one-hundredth of a percentage point, or 1 basis point = 0.01 percentage point.
[5] Besides the interest rate, there are a number of other reasons which explain the variation in the jumbo-conforming spread since 2010, including an increase in government-sponsored enterprise (GSE) guarantee fee, a reduction in the GSE funding advantage and portfolio lenders’ desire to hold jumbo loans.
[6] Risk-based pricing is the process through which lenders tend to charge premiums for higher-risk mortgages and lower rates for lower-risk loans.
[7] Figure 3 plots the estimates for the jumbo-conforming spread from a regression equation run for each quarter.


