Higher Debt-to-Income and Lower Credit Scores in Q1 2022 Compared with Q1 2021 for Conventional Conforming Loans
Rising interest rates and higher home prices erode home buyer affordability as fewer buyers can afford higher home mortgage costs. As a result, the diminishing demand from borrowers may lead to expansion of mortgage credit availability and mortgage risk as more borrowers are considered who may have not otherwise qualified for a mortgage when demand was higher.
Three key factors in mortgage underwriting include:
Debt-to-income (DTI) Ratio: The amount of a household’s outstanding monthly bills and payments versus its earnings
Loan-to-Value (LTV) Ratio: The amount borrowed versus appraised value of a home
Credit Score (FICO): Based on credit history, which predicts the likelihood that the owner will repay a loan on time
An individual’s credit score is based on rankings from the principal United States credit bureau.
Beginning in early 2020 with the onset of the COVID-19 pandemic, we observed tightening of mortgage credit availability. Both the average DTI and LTV declined, while average credit score of loan applicants increased. However, mortgage credit availability and risk expanded in Q1 2022 as interest rates increased, leading to higher DTI and slightly lower FICO scores. The LTV remained unchanged.
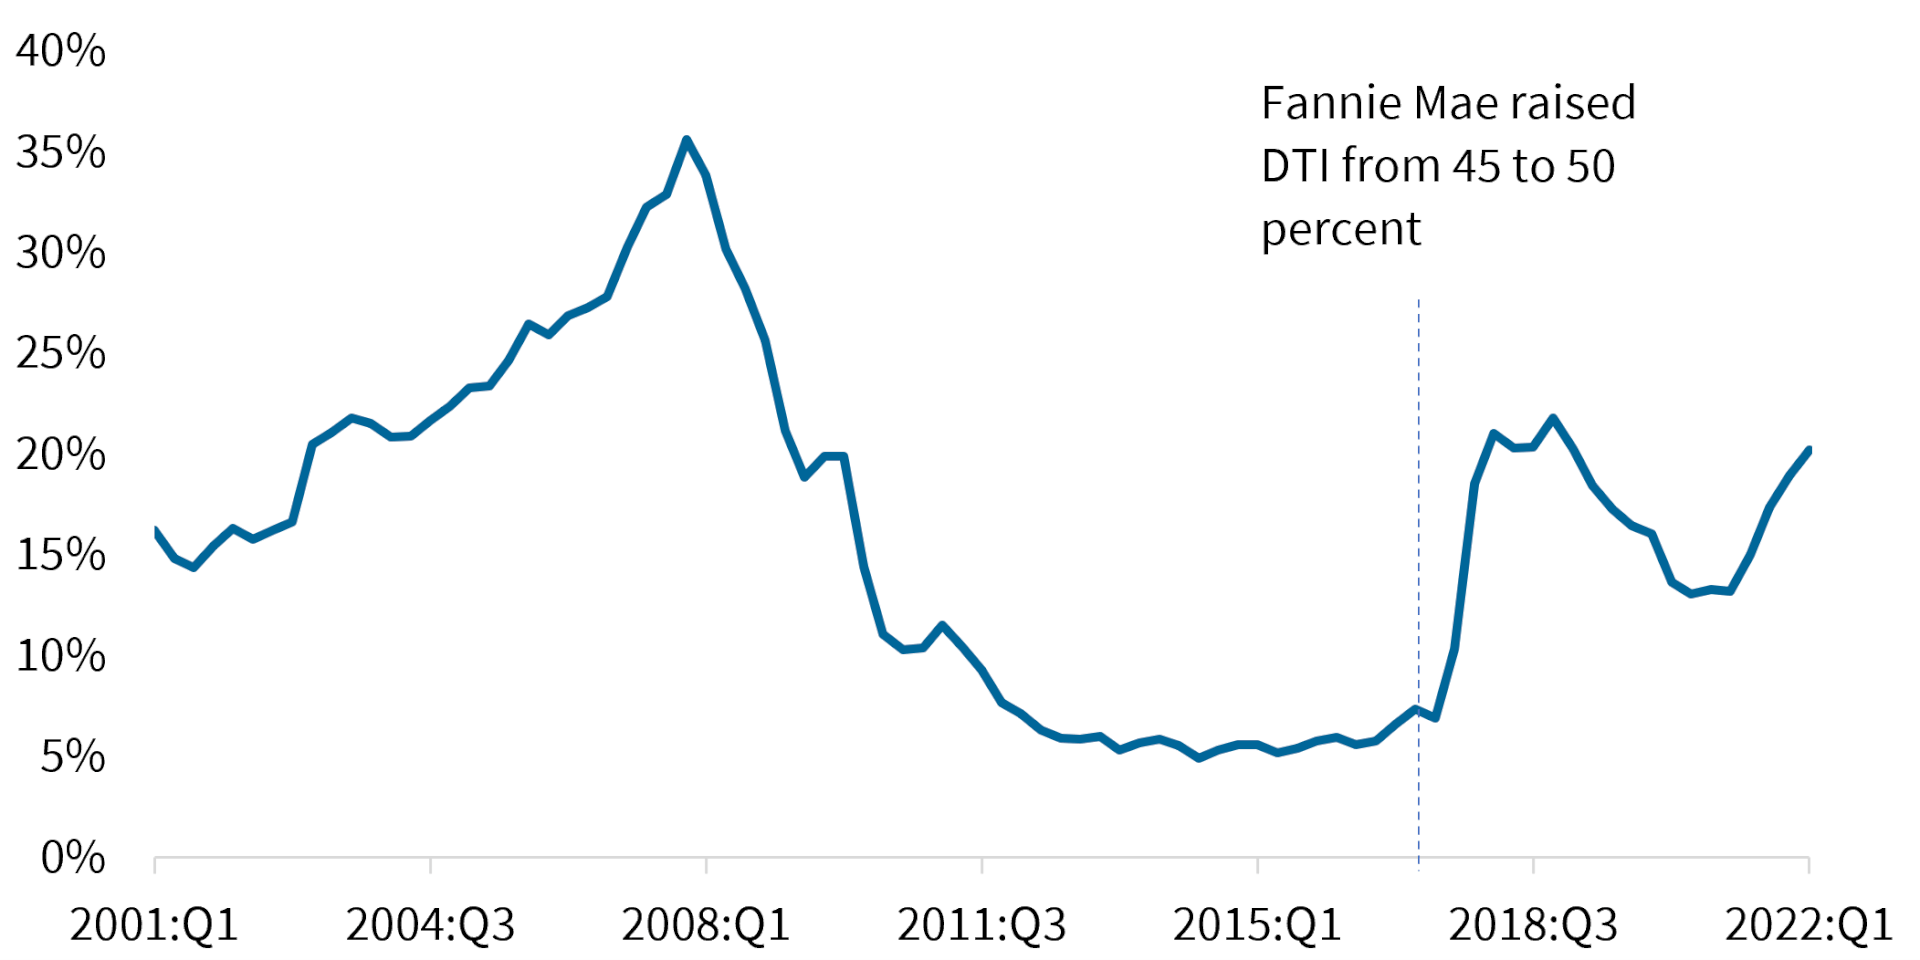
Figure 1 illustrates the 20-year trend of the share of conventional conforming home-purchase loans with a DTI ratio above 45%. In 2017, after Fannie Mae started accepting loans with higher DTIs, the share of higher DTI loans rose sharply.[1]
Prior to Fannie Mae’s 2017 announcement and following the Great Recession, the share of high DTI loans held steady between 5% to 7%. Following the Fannie announcement, the share of higher DTI loans increased and reached its post-Great Recession peak of 21% in the fourth quarter of 2018. The share shrunk once again during the pandemic to 13%. However, with higher mortgage interest rate in 2022, the share jumped to 20% in Q1 2022.
In addition to higher share of high DTI loans, the average DTI ratio for new conventional conforming home-purchase loans rose by 2 percentage points to 37% from Q1 2021 to Q1 2022. The increase in the average DTI and in the share of loans with a DTI ratio above 45% in 2022 illustrates the impact of higher rates on the need to expand the credit box to include more riskier borrowers.
Figure 1: Share of Conforming Conventional Home-Purchase Loans with DTI Ratio Above 45 Percent

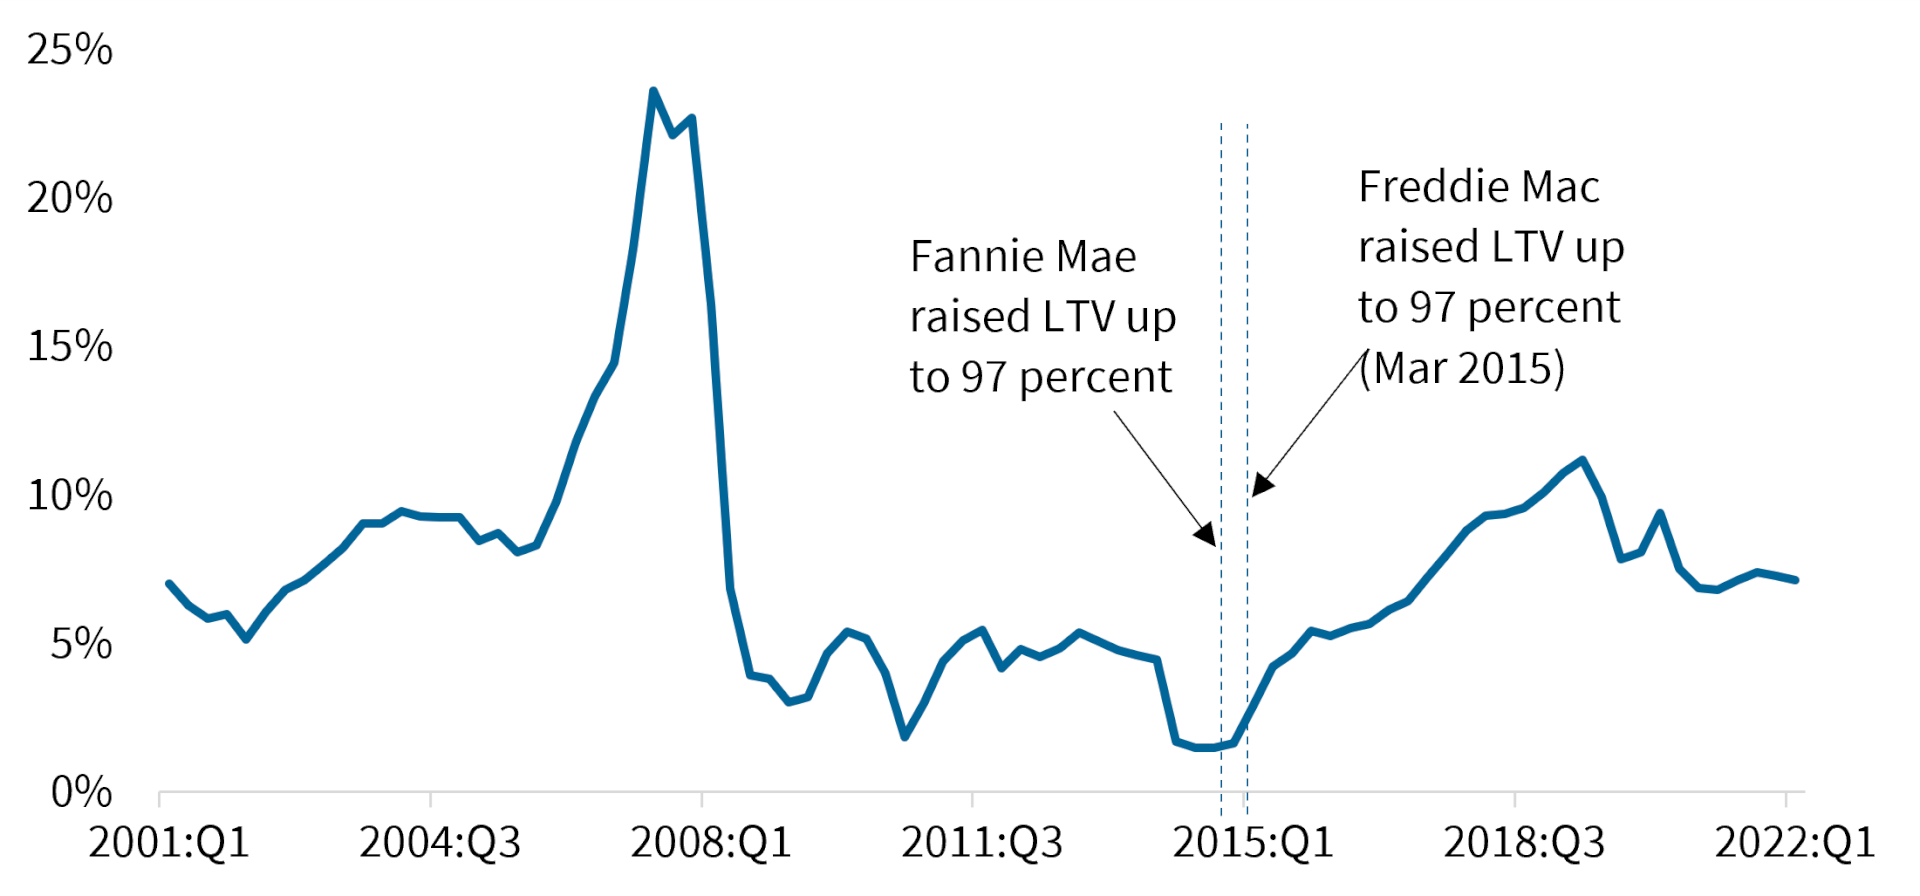
Similarly, Figure 2 shows that the share of new conventional conforming home-purchase loans with an LTV ratio above 95% started to rise in early 2015 following the government-sponsored enterprises’ (GSEs) announcement of higher maximum LTVs. The share was less than 2% in 2014 but reached 12% by Q2 2019, the highest since 2008. Following the tightening of credit availability at the onset of the pandemic, the share of high LTV loans fell slightly below 7% and has been hovering around 7% since then. The average LTV ratio for home-purchase loans in Q1 2022 was 82 percent, unchanged from the same quarter of 2021.
Figure 2: Share of Conforming Conventional Home-Purchase Loans with LTV Ratio Above 95 Percent

Though DTI and LTV ratios have been affected by the pandemic and recent increase in mortgage rates, there has not been much change in credit score standards. During Q1 2022, the average credit scores for homebuyers with conventional conforming home-purchase loans fell by just three points compared to the same quarter in 2021.
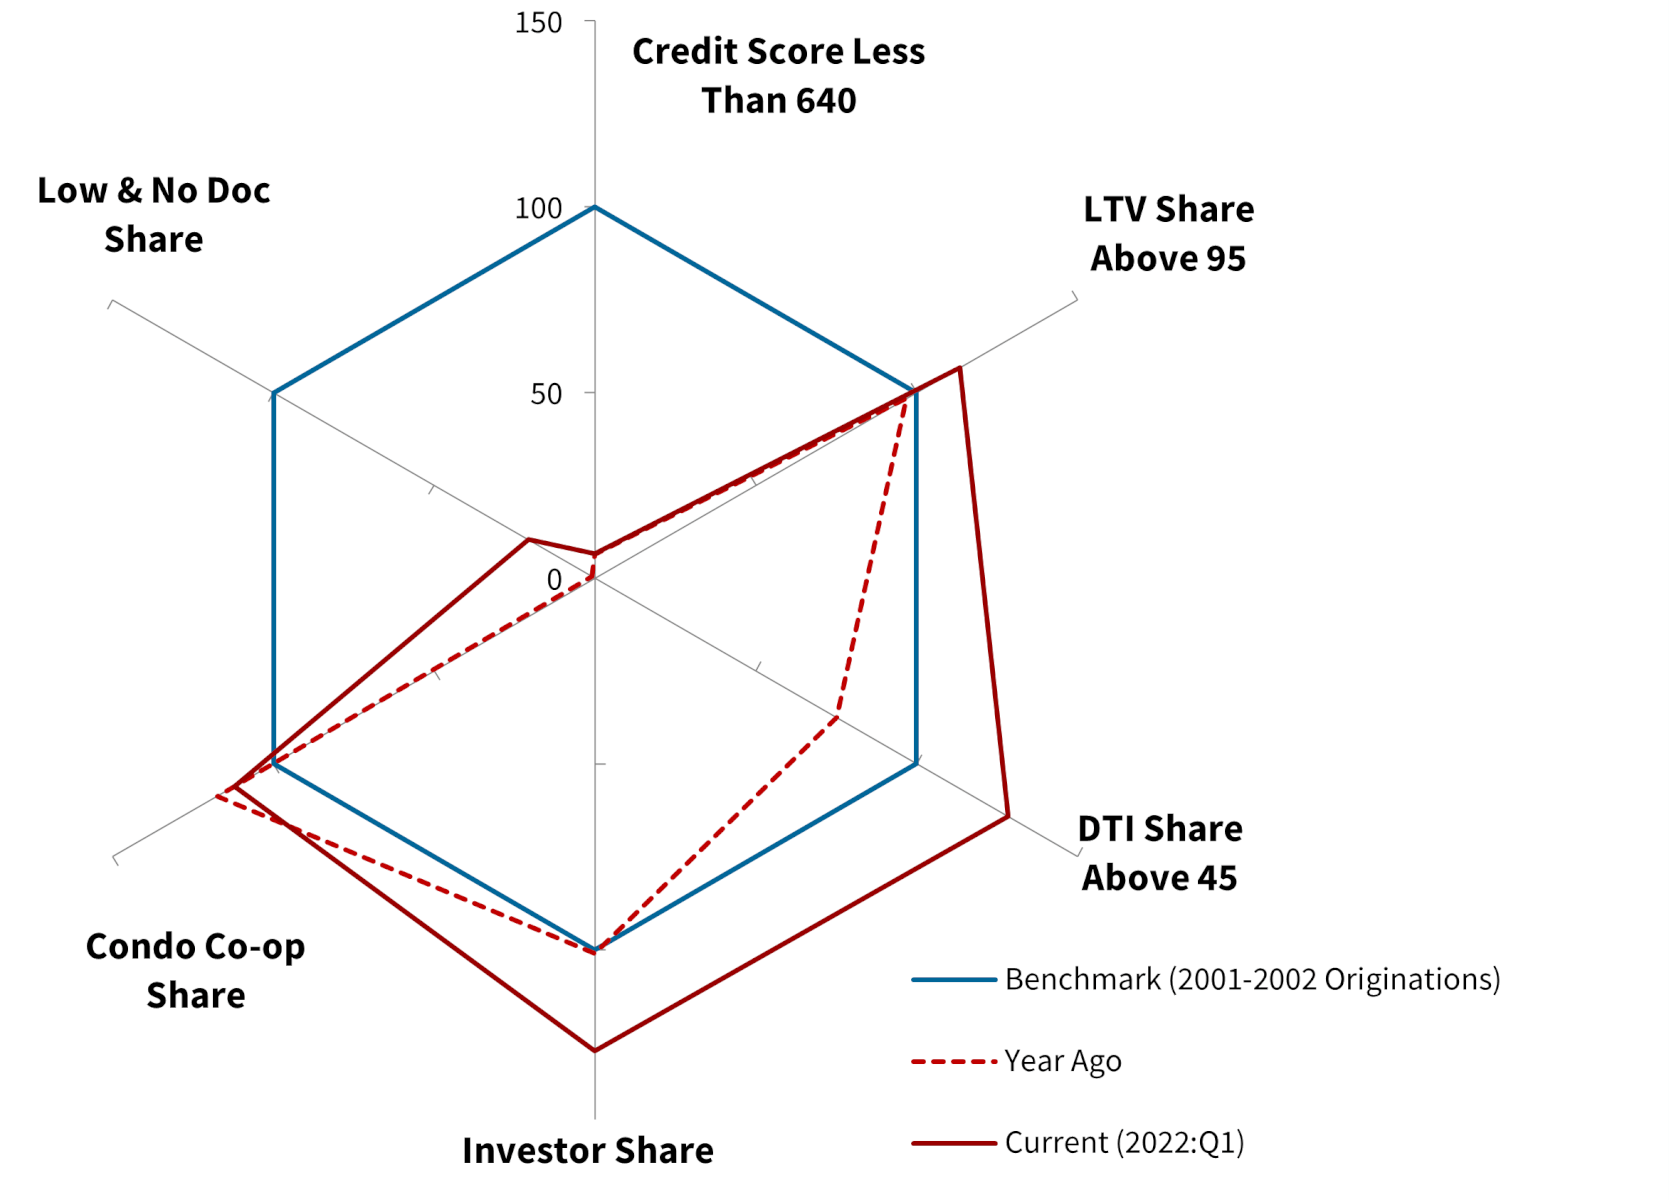
Besides LTV, DTI and FICO score, no/low documentation share, condo share, and investor share are also considered as indicators of underwriting standards and credit risk. Figure 3 compares these six indicators during a benchmark period in 2001-2002, and in Q1 2021 and Q1 2022 for conventional conforming home-purchase loans. The blue hexagon represents an index of credit-risk attributes in the benchmark period and the solid red polygon represents characteristics of loans originated in Q1 2022, relative to the benchmark. Likewise, the dotted red polygon represents characteristics of loans originated in Q1 2021, relative to the benchmark.
The share of borrowers with a credit score less than 640 as well as the no/low documentation loan share were both down significantly compared to the 2001-2002 benchmark level. However, the low documentation loan share went up by 20% in Q1 2022 from a year prior.
In contrast, the share of new loans with an LTV ratio higher than 95% was 13% higher in Q1 2022 than the benchmark level and 17% higher than a year ago. Also, the share of new loans with a DTI ratio above 45% was 28% higher than the benchmark level and 53% higher than a year ago.
The condo/co-op share was 12% higher than the benchmark level, and the investor-owned share was 27% higher than the benchmark level. The rise in investor activity has been reported in other CoreLogic data as well.
Since the Fed increased the Federal Funds rate in March 2022 to tackle inflation, mortgage rates continued to move upward. Rates increased by almost one percentage point in Q1 2022 from the same quarter in 2021. The increase in share of loans with a DTI ratio above 45% reflects worsening affordability attributed to higher mortgage interest rate and higher home prices. Also, the other credit-risk attributes suggest that worsening of affordability has led to widening of mortgage credit availability in 2022, a trend we are likely to remain.
Figure 3: Six Credit-Risk Attributes for Conforming Conventional Home-Purchase Loans: Q1 2022 Compared with 2001-2002

Note: The share of loans made during 2001-2002 with the credit-risk attribute shown on the axis are set equal to 100.
[1] To expand the credit box to creditworthy borrowers, Fannie Mae began accepting mortgages with LTV ratios up to 97% in December 2014. Freddie Mac began accepting them in March 2015. To further expand access to credit, In May 2017, Fannie Mae announced it would consider mortgage applications with debt-to-income (DTI) ratios up to 50 percent, up from 45 percent, in their automated underwriting system.


