Midwestern metro areas such as Cleveland and Chicago are now the hottest housing markets, while Mountain-West pandemic boomtowns like Denver and Phoenix are now among the coolest
While home prices have shown a lot of strength so far in 2023, elevated mortgage rates are making it difficult for many potential buyers to purchase properties, which will likely keep a lid on additional gains for the rest of the year. Nevertheless, home prices are still expected to continue to reaccelerate and reach mid-single-digit growth rate by the year’s end, according to CoreLogic’s latest Home Price Index forecast.
Acceleration in home prices was most notable in markets that remained relatively affordable throughout the pandemic and that saw less shifts as a result of household migration, such as those in the Midwest and New England. Home prices in these markets are now catching up with traditionally more expensive ones.
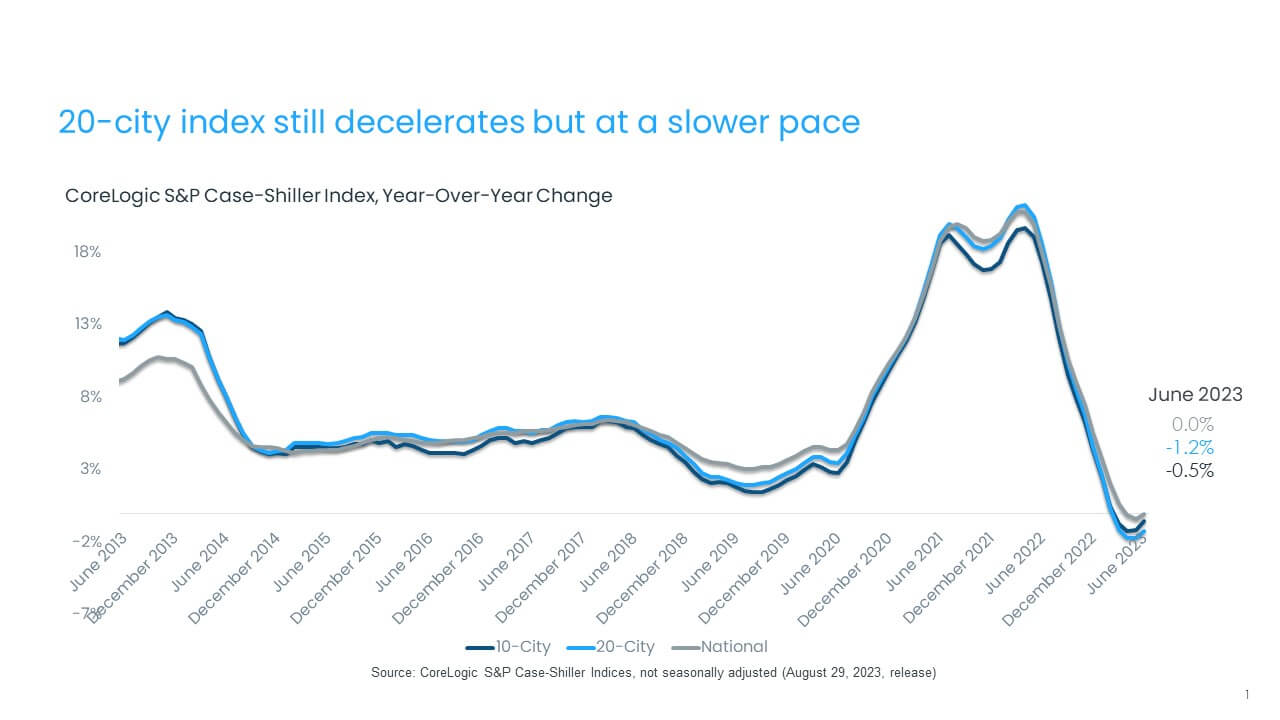
- In June, the CoreLogic S&P Case-Shiller Index remained flat year over year. However, this reflects price drops that occurred in 2022. (Figure 1).
© 2023 CoreLogic,Inc., All rights reserved.
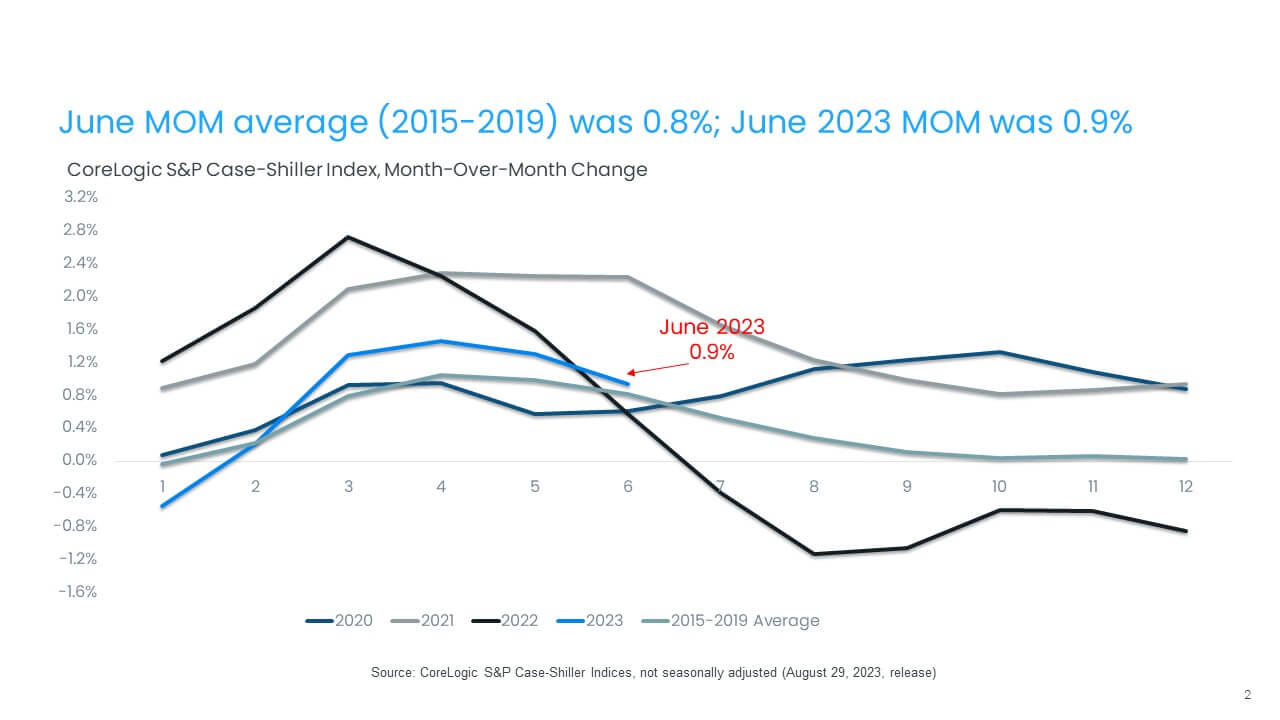
- The non-seasonally adjusted, month-over-month index posted its fifth month of gains, up by 0.9% in June. This is a smaller increase than the one recorded in May (1.3%), as price gains are plateauing in response to higher mortgage rates. With five months of monthly gains, home prices are now up by 5% from February of this year and are even with their 2022 peak. (Figure 2).
© 2023 CoreLogic,Inc., All rights reserved.
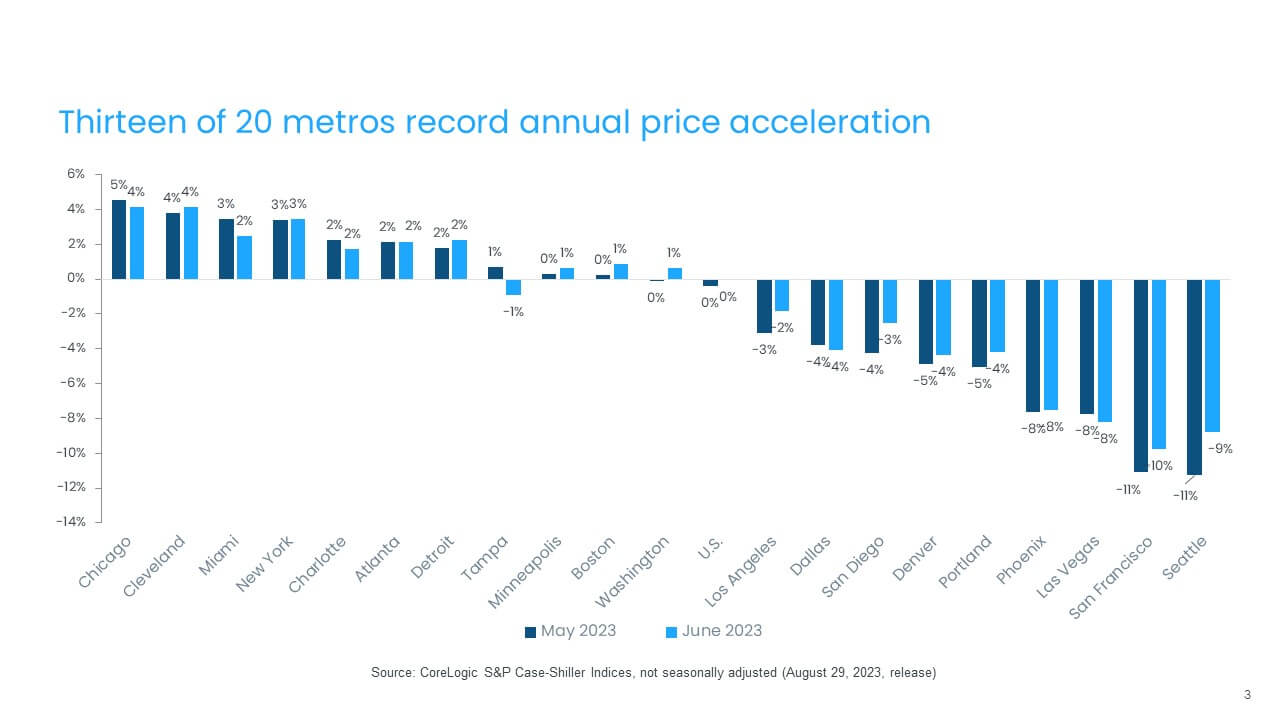
- In June, 13 metros saw annual home price gains pick up steam from the month before, with the most notable reacceleration in West Coast markets, particularly San Diego and Seattle, followed by San Francisco and Los Angeles (Figure 3).
© 2023 CoreLogic,Inc., All rights reserved.
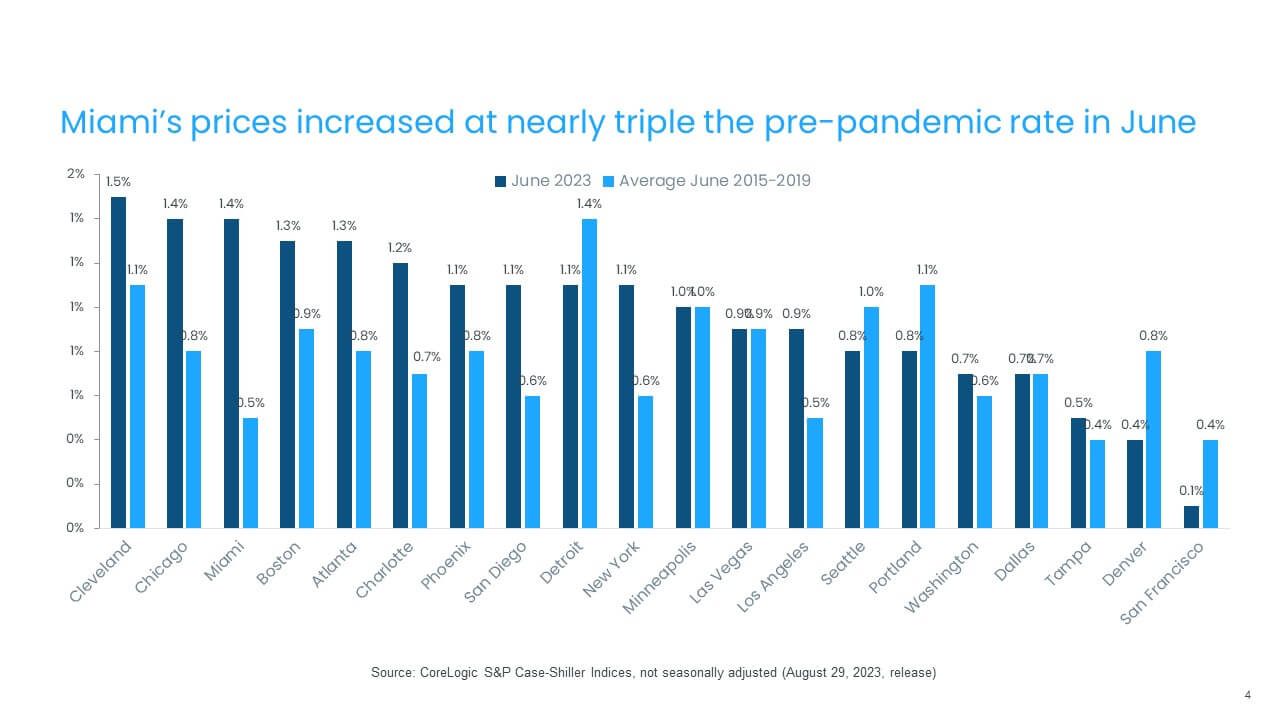
- Cleveland and Chicago posted the nation’s largest monthly gains, at 1.5% and 1.4% respectively, while Sam Francisco, Denver and Tampa, Florida showed the smallest gains of less than 0.5%. And while Chicago and Miami saw outsized increases in June, the gains in slower-growing metros are in line with seasonal increases that are historically recorded between May and June (Figure 4).
© 2023 CoreLogic,Inc., All rights reserved.
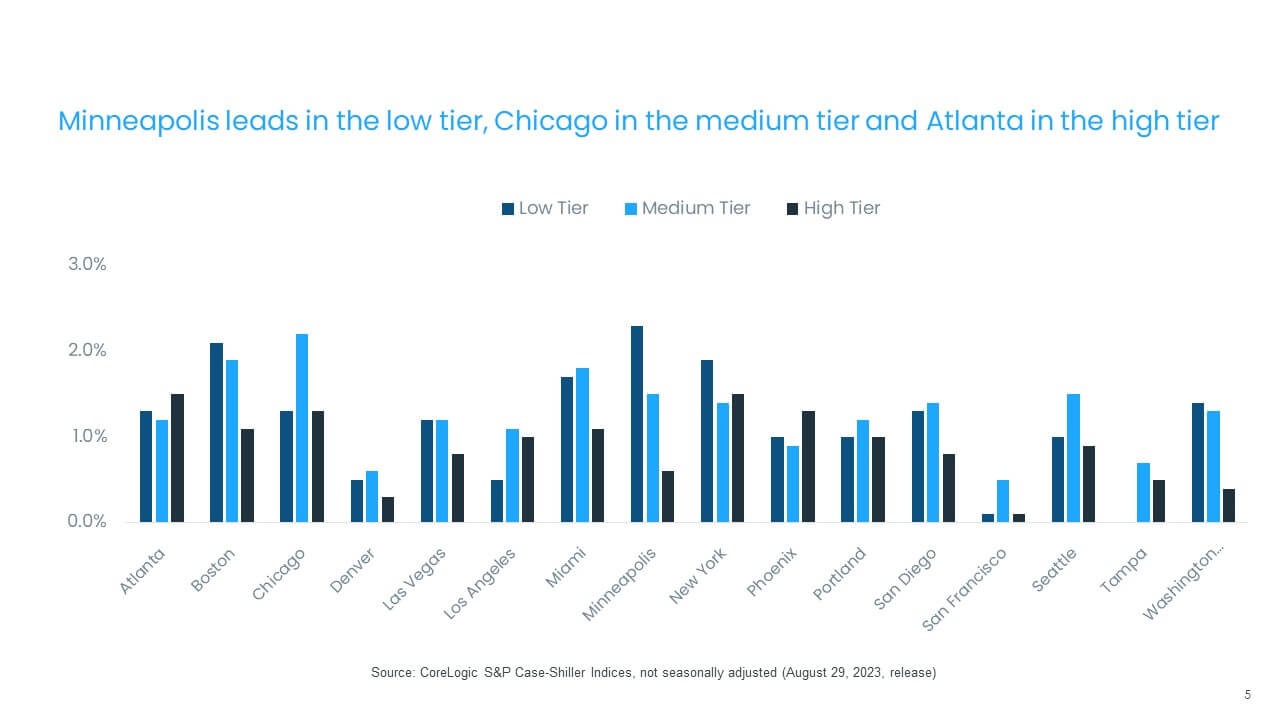
- Across price tiers, the high tier continued to show relative weakness, -2.6% year over year, the fourth month of annual declines and similar to trends observed in CoreLogic’s Single-Family Rent Index. This trend may reflect the greater mobility of higher-income households during the pandemic, which has since slowed. In addition, the surge in demand for luxury and second homes seen in 2021 and 2022 also contracted relatively more since the increase in mortgage rates and stalling home sales.
- While high-tier home prices have generally been weaker, some markets have recorded more strength at this price point in recent months, such as Atlanta and New York, which were both up by 1.5% from the previous month (Figure 5).
- The slowest gains across price tiers was the low-priced tier in Tampa – showing no price growth from the previous month. (also Figure 5).
© 2023 CoreLogic,Inc., All rights reserved.


