Further insights on balancing risks (loan delinquency) and benefits (mortgage credit access) in the QM Safe Harbor, following expiration of the GSE Patch
In our previous blog, Part IV of our QM blog series, we examined the balance of risks (loan delinquency) and benefits (mortgage credit access) in the QM Safe Harbor following expiration of the GSE Patch.
In this follow up we further validate our empirical evidence by analyzing loan delinquency by rate spread category for both purchase and refinance loans originated in 2018.[1] Our previous blog analyzed a 2010-2017 cohort of home-purchase loans. Because HMDA did not require reporting of rate spreads below 1.5% until 2018, the previous analysis was unable to compare loan delinquency for rate spread categories below 1.5% for Conventional loans.
Beginning in 2018, HMDA requires most lenders to report rate spread on all loans whether negative or positive with a minimum of 3 decimal points. Conventional loans are classified as QM Rebuttable Presumption loans (Higher-Priced Mortgage Loans) if the Annual Percentage Rate (APR) exceeds the Average Prime Offer Rate (APOR) for loans of a similar type by at least 1.5 percentage points for first-lien loans or 3.5 percentage points for junior-lien loans.[2] As mentioned in blog Part IV, Conventional loans that are not higher-priced, i.e. with rate spread below 1.5%, are deemed QM Safe Harbor.
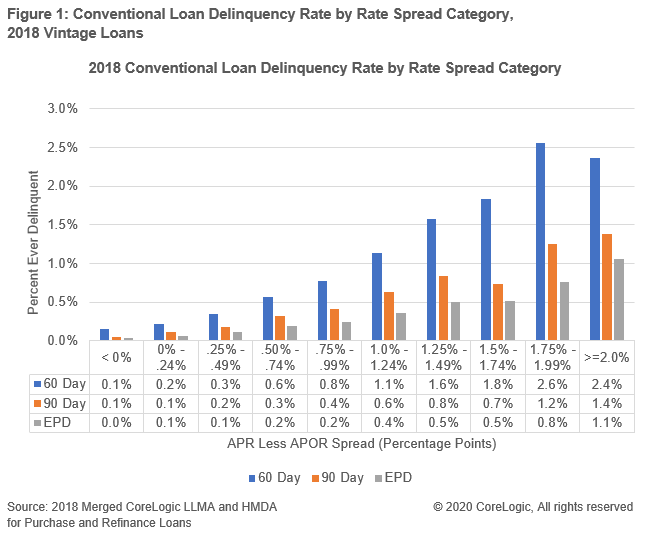
Figure 1 displays 60-day, 90-day, and early payment default (EPD) delinquency rates for Conventional loans.[3] The delinquency rates are displayed by rate spread category, in increments of 0.25 percentage points. Consistent with our prior analysis, Figure 1 shows that the delinquency rate was lowest for loans with a rate spread below 0 and highest for the loans with rate spreads above 2.0%. There were notable increases in loan delinquency as rate spreads increased. However, also consistent with our prior analysis, we observe little variation overall in the Conventional loan delinquency rates between the 1.25% – 1.49% and 1.50% – 1.74% rate spread categories, respectively: EPD rates were about the same for each rate spread category (0.5%), and the 60 day delinquency rate was only slightly higher for the 1.50% – 1.74% rate spread category (1.8%) as compared with the 1.25% – 1.49% rate spread category (1.6%). While the factors that might account for these variations will require further research, the similarity in Conventional loan delinquency rates from 1.25% over APOR through 1.74% over APOR further suggests that closer examination into whether the QM Safe Harbor rate spread cap is appropriately calibrated, all things equal, is reasonable.

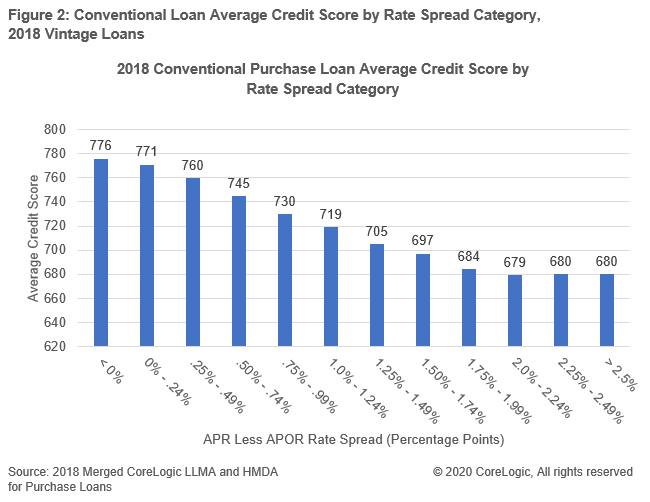
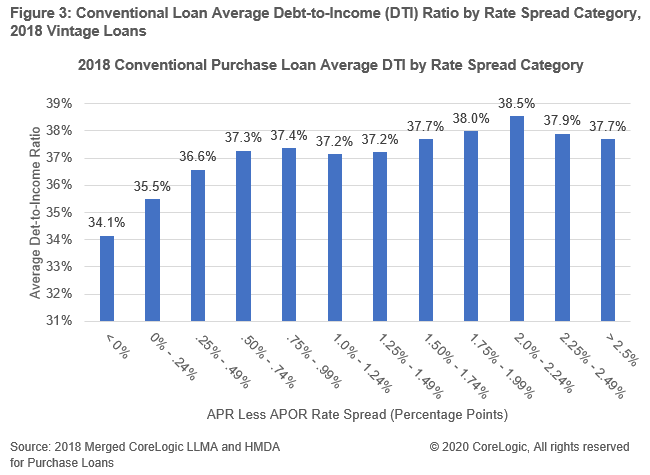
As reviewed in blog Part IV, Credit Score and Debt-to-Income Ratio (DTI) are today two underwriting criteria (among others) that help an underwriter assess borrower ability-to-repay and are also among a broader set of underwriting criteria used today to price credit risk.[4] Consistent with blog Part IV, analysis of 2018 merged LLMA and HMDA data demonstrates that as the underwriting attributes of a loan degraded, rate spread (loan pricing) and borrower delinquency both increased. For example, rate spreads are higher for Conventional loans with lower Credit Scores and higher DTIs to compensate for the additional expected delinquency risk. Figures 2-3 demonstrate averages of Credit Scores and DTI by rate spread category for Conventional home-purchase loans originated in 2018.


In conclusion, our analysis of 2018 merged CoreLogic LLMA and HMDA data appears to validate and reinforce our findings from blog Part IV. As borrower ability-to-repay (capacity)-related underwriting attributes deteriorated, the rate spread (loan pricing) and borrower loan delinquency both increased.
When considering the impacts of the expiration of the GSE Patch, policymakers ultimately have a difficult judgment call to make with respect to whether the benefit of increasing the QM Safe Harbor rate spread cap (loan pricing) for Conventional loans exceeds the risks of increased borrower loan delinquency (a proxy for borrower repayment sustainability), all things equal. Moreover, regardless of whether the QM Safe Harbor rate spread cap is ultimately increased, consideration of the proper role for ability-to-repay-specific underwriting criteria (including methods for calculating underwriting criteria and verifying borrower financial resources) in a new ATR/QM Rule is warranted. These judgments become particularly relevant in the event our economy experiences a recession, placing upward pressure on delinquency rates.
[1] CoreLogic Loan-Level Market Analytics (LLMA) data was merged with 2010-2018 HMDA data by employing a unique matching technique that linked LLMA loan performance data to HMDA origination data. The match was based on loan characteristics, such as the loan amount, the loan purpose, the loan type, census tract, origination year, and the lender identity key. The overall match rate was about 50% of the LLMA data. Performance of loans were tracked as of October 2019. We include both purchase and refinance loans in our loan delinquency analysis to provide a comprehensive review.
[2] See CFPB website https://www.consumerfinance.gov/ask-cfpb/what-is-a-higher-priced-mortgage-loan-en-1797/
[3] Early payment default is defined as 90 days or more past due within the first year of mortgage origination.
[4] Underwriting methodologies are often referenced according to the “Three C’s” of “Capacity, Credit, Collateral.” “Capacity” refers to the borrower’s ability to repay their mortgage loan, all things equal. DTI is a traditional underwriting measure for this purpose. “Credit” refers to both borrower ability to repay but also, importantly, their willingness to repay; a borrower could have the ability to repay their loan, but their past credit history indicates that they choose not to nonetheless. Credit Score is a traditional underwriting measure of borrower Credit (as well as Capacity). Finally, “Collateral” refers to the borrower’s down payment or “skin in the game,” which bears on both their willingness to repay, but also serves as an important lender mitigator of loss severity; in the event the borrower defaults on their mortgage loan, the greater the borrower’s equity, the lower the loss severity for the lender. Loan-to-Value Ratio (LTV) is a traditional underwriting measure of Collateral. Given that QM is part of an Ability-to-Repay Rule, our analyses focus on DTI and Credit Score as two underwriting measures considered common to assessing borrower ability to repay today. Other underwriting criteria could augment or replace these measures including borrower cash flow analyses and liquid asset reserves. It is also important to note that APR (i.e., the “all-in” pricing of the loan) is intended to be a reflection of the “Three C’s” holistically. As such, while borrower ability to repay is certainly reflected in the APR, it is not the only consideration reflected in the APR.
© 2020 CoreLogic, All rights reserved


