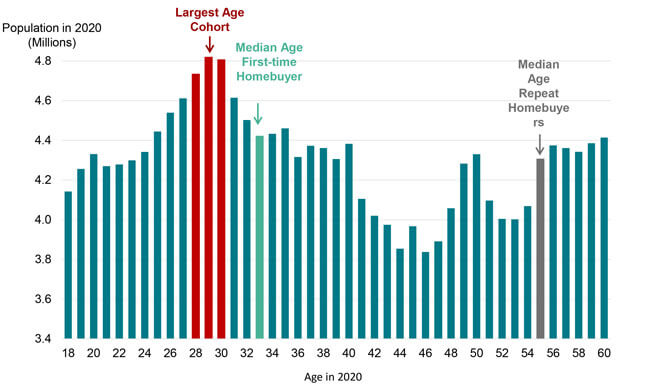
While pandemic-induced housing demand has ensured 2020 home purchase activity has reached the highest level since 2006, demographic trends suggest strong home buying demand is likely to continue. Between 2018 and 2028, the number of households are forecasted to grow by as much as 12 million[1] with Gen X and Millennials driving most of the household formations and adding almost 25 million new households through 2028. But, while the wave of millennials has started entering the home purchase market, the largest age cohorts, those aged 28 to 30 and almost 15 million strong, are yet to turn the typical first-time home buying age of 33 years old[2]. Figure 1 illustrates the 2020 population distribution for those between the age of 18 and 60.

But, amid the strong demand, the inventory of homes for sale has reached the lowest levels in recorded data going back to 1982. In 2020, average for-sale inventory was 63% of the 1982 level. And while lower turnover rates since the Great Recession are a partial culprit of low for-sale inventory, the U.S. has had two decades of bleak housing construction – since 2000, the U.S. has gained 46 million people and only 20 million housing units. In the two decades prior, the country gained 45 million people and 35 million housing units.. The imbalance has led to housing costs increasing at a faster rate than incomes. Since 2000, home prices have increased 1.6 times the rate of real household incomes. And, according the latest CoreLogic Home Price Index, home prices continue to grow at the fastest pace since 2014.
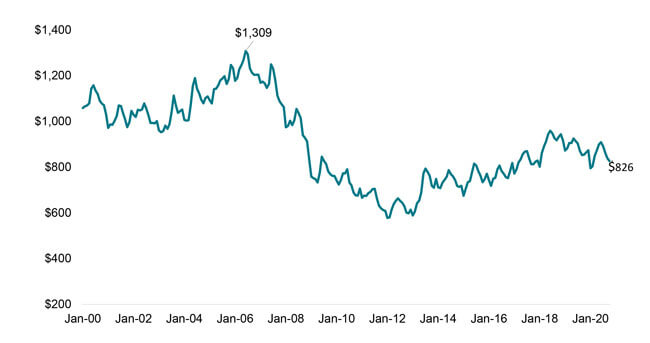
Nevertheless, the record low mortgage rates that have characterized 2020 have kept the inflation-adjusted typical monthly mortgage payment relatively affordable, about 36% below the 2006 peak and about 23% below the typical payment 20 years ago (Figure 2).

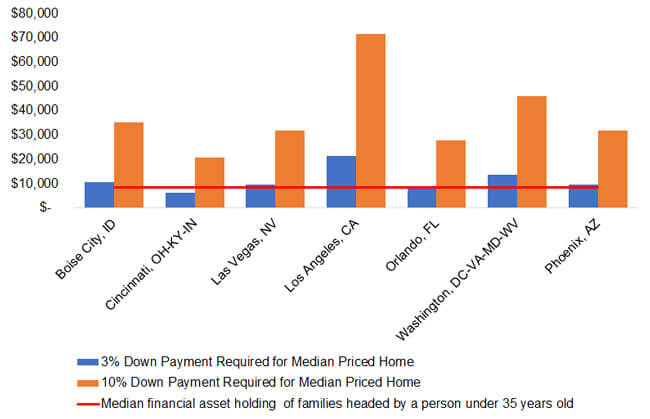
But while monthly payment may be more affordable, first-time home buyers may face a more difficult challenge of coming up with a down payment. To illustrate, Figure 3 summarizes the change in affordability from a year ago for a home that a first-time buyer may be purchasing and suggests that while monthly payment and insurance have fallen by 3% from a year ago, the down payment needed is up 8% – from about $20,000 to about $22,000 for a 10% down payment on a home priced at $225,000. This may be a daunting challenge for some particularly given that the median financial asset holding of families headed by a person under 35 years of age is only about $8,500[3]. In looking at affordability changes over the next 5 years, our forecasts suggest further deterioration in affordability – with down payment increasing 22% and monthly payment up 35%.
| First-Time Buyer | A Year Ago | Today (August 2020) | 2025 |
| Home price | $207,948 | $225,000 *** | $274,500 ** |
| Down Payment (10%) | $20,795 | $22,500 | $27,450 |
| Loan size | $187,153 | $202,500 | $247,050 |
| Mortgage rate | 3.70% | 2.80% | 3.62%**** |
| Monthly P&I | $855 | $828 | $1,118 |
| Change from a Year Ago | Change from 2020 to 2025 | ||
| Down Payment | 8% | 22% | |
| Monthly P&I | -3% | 35% | |
| * Homes in 75% to 100% of median home price increased 8.3% over the last year | |||
| ** Home prices expected to increase by about 22% between 2020 and 2025 | |||
| *** 75% of median U.S. home price in August 2020 **** Based on IHS Market Forecast, December 2020 |
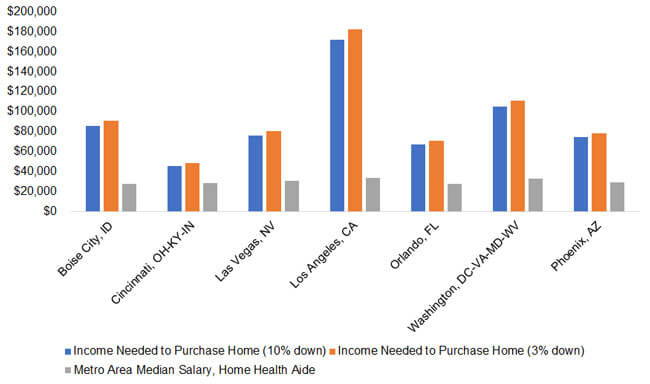
The affordability challenge is further amplified as almost half of the employment growth (43%) over the next 9 years is in occupations that earn an annual wage of less than $30,000 – home health and personal care aides and food preparation and serving related occupations[4]. With data from the National Housing Conference “Paycheck to Paycheck 2018”, Figure 4 illustrates the income needed to purchase a home with 3%, and 10% down, and the median wage of a home health aide person. Unfortunately, even in relatively more affordable metros, such as Cincinnati, income needed to purchase a home outpaces the income earned for lower-wage workers.


[1] Harvard University Joint Center for Housing Studies Household Growth Projections for 2018-2028
[2] NAR 2019 Profile of Home Buyers and Sellers
[3] Source: Federal Reserve, The 2019 Survey of Consumer Finances
[4] Source: 2019 Employment Projections program, U.S. Bureau of Labor Statistics

