Tenant moves slowed early in the pandemic and have rebounded
- Applications for rental homes fell sharply early in the pandemic and have rebounded.
- Apartment building rents fell in the third quarter, whereas single-family rents continued to rise.
- Multifamily property values fell 10% on average across 10 metros in the second quarter.
The rental market provides shelter to one-third of American households. Let’s review how the pandemic has affected tenant mobility, rents, and property values.
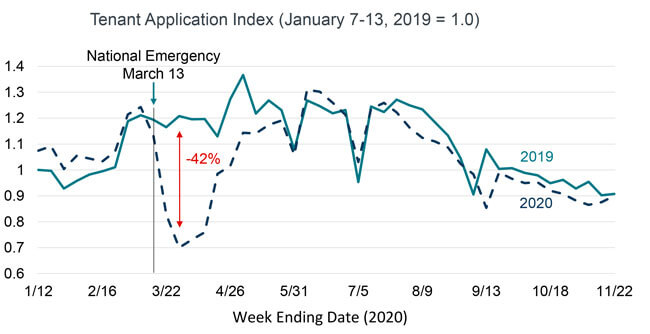
Applications by prospective tenants for a rental home generally pick-up each spring. The President’s declaration of a national emergency on March 13 triggered Shelter-In-Place restrictions and disrupted the seasonal rise. By the end of March applications for rental homes were down 42% from the same period one year earlier. (Figure 1) As Shelter-In-Place orders were relaxed, applications rebounded. By the end of May applications were running at the same pace as the year before and continued at the prior year’s pace for the rest of 2020.

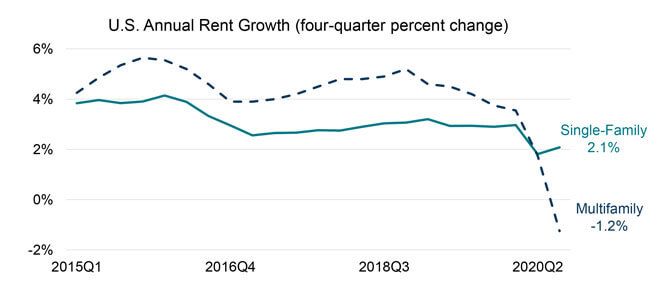
But the types of rental homes that tenants were looking for appears to have shifted away from high-density apartment buildings and to low-density single-family homes. Rent growth slowed after the pandemic began as applications for vacant homes declined sharply. Even though tenant applications rebounded late spring, tenants revealed a preference for lower density structures. Effective rents declined 1.2% in apartment buildings in the third quarter as vacancy rates rose and property managers often provided concessions to attract tenants. In contrast, the CoreLogic Single-Family Rent Index rose 2.1%. (Figure 2)

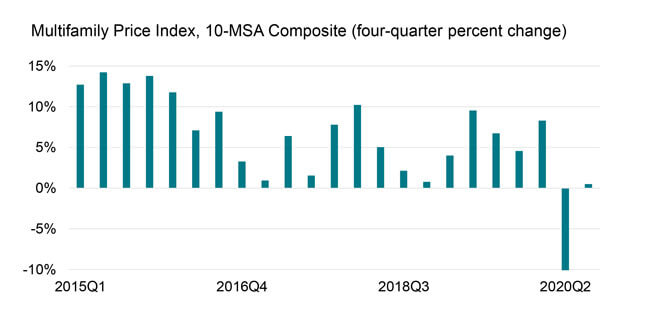
Higher vacancy and lower effective rent result in reduced net operating income. Using CoreLogic public record data to create a multifamily price index, we found that multifamily values fell about 10% in the second quarter, the first annual decline since the Great Recession. With cap rates declining to a record low in the third quarter, property values rose slightly. (Figure 3) In comparison, the CoreLogic Home Price Index for homes priced between 75% and 100% of the median – the price range that single-family rentals often are within – had annual increases of 5% and 7% in the second and third quarters, respectively.

The first two months of the pandemic temporarily delayed tenant mobility, but the effect on tenants’ preferences for shelter appears to be more lasting. Based on rent growth and property valuations, tenant desire for single-family rental has increased at the expense of high-rise apartment buildings.
© 2021 CoreLogic, Inc. All rights reserved.
Get the CoreLogic Economic Outlook for January 2021 on YouTube. Each month, CoreLogic Chief Economist Dr. Frank Nothaft will provide data driven analysis for the economy and property industry. For more insights, subscribe to our YouTube channel.
Note: Yanling Mayer provided modeling expertise to construct the multifamily price index. The 10-metro composite index is a weighted average of repeat-sales indexes estimated separately for 10 metropolitan areas; the weights are the dollar value of rent payments per metro, using the median rent and number of occupied rental homes from the American Community Survey. The 10 metropolitan areas are New York, Los Angeles, Chicago, Atlanta, Miami, Phoenix, Portland, San Diego, San Francisco, and Seattle.


