Detached Home Rent Growth Accelerated While Attached Home Rent Growth Slowed
- New research shows that rent growth differs greatly when accounting for property type.
- Detached property rent growth more than doubled in February 2021 compared with February 2020.
- Attached property rent growth slowed to less than one-quarter of overall rent growth in February 2021 compared with February 2020.
Single-Family Overall Rent Growth
While home prices skyrocketed in response to low interest rates and low housing stock, single-family rental properties have also experienced a pickup in rent price growth. Single-family rents posted 3.9% year-over-year growth in February 2021; this was the strongest February in the past 5 years, as measured by the CoreLogic® Single-Family Rent Index (SFRI).
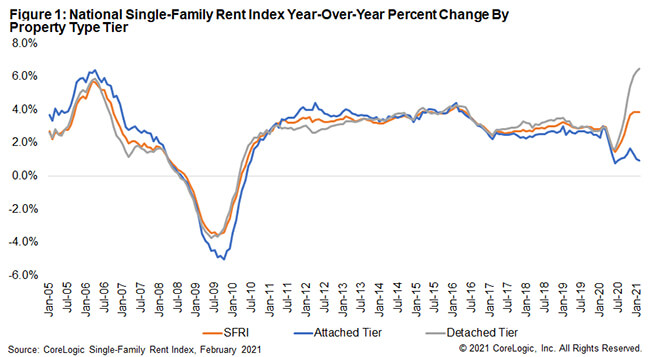
Recovering from the low of 1.4% year-over-year growth in June 2020, the index has shown solid increases since the second half of 2020, propped up by the rent growth in detached properties. By October 2020, the rent growth compared to a year prior had returned to pre-pandemic levels.
Single-Family Rent Growth by Property Type
The SFRI measures rent changes among single-family residences, including condominiums, using a repeat-rent analysis to measure the same rental properties over time. New research shows that rent growth differs greatly between attached and detached property types.
CoreLogic developed two new index tiers based on property type: a detached tier and an attached tier. The detached tier is defined as properties with a free-standing residential building, and the attached tier is defined as a single-family dwelling that is attached to other single-family dwellings, which includes duplexes, triplexes, quadplexes, townhouses, row-houses, condos and co-ops.
When the COVID-19 pandemic began to take hold in the U.S. in March 2020, rent growth in detached properties reached a new high as demand shifted away from attached properties. During this time, rent price growth started to diverge between attached and detached properties (Figure 1).

The pandemic increased demand for lower density living, as people sought more space—be it for a home office or for extra social distancing. That desire has translated into higher rent growth for detached properties. As a result, many people moved out of condos and apartments in the center of cities to detached properties in lower density areas.
Rent prices for detached properties increased 6.5% year-over-year in February 2021, up from 3% in February 2020. This was the record high in rent growth for detached properties.[1] Simultaneously, attached properties were struggling, with just a 0.9% year-over-year increase in February 2021, down from 3% in February 2020. This was only 0.1 percentage point above the low of 0.8% year-over-year increase in June 2020.
Metro-Level Results
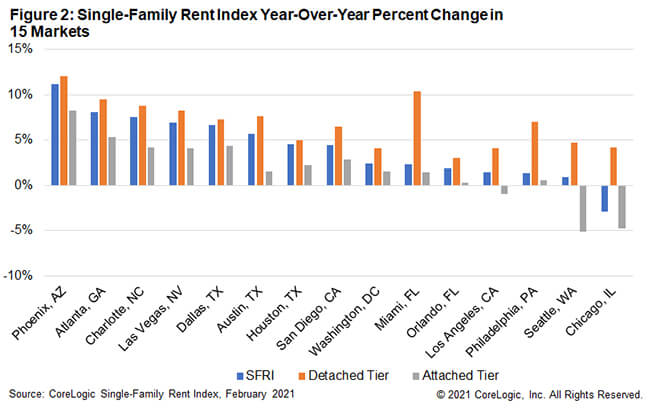
Rent growth varies significantly across metro areas[2], and the share of attached versus detached properties is no different. Figure 2 shows the year-over-year change in the rental index for 15 large metro areas in February 2021 by property type.

Most markets had higher year-over-year rent growth in detached properties compared to attached properties. Among the 15 metro areas shown, Phoenix had the highest year-over-year rent growth of 11.1% in February 2021 and posted double digit growth for detached properties. On the other hand, Chicago continued to show declines in rent prices compared to a year ago. The city has over 70% of its single-family rental portfolio in attached properties[3] which are experiencing rent decreases and pulling down the overall rent growth.
While detached rentals have had a spurt of rent price growth, with vaccines soon be available to the entire adult population, employers may begin considering having their employees return to the office. This could help increase the demand for attached rental properties in the near future, as people move back towards city centers to decrease their commute time.
©2021 CoreLogic, Inc., All rights reserved.
[1] The CoreLogic SFRI series begins in 2004.
[2] Metro areas used in this report are Core Based Statistical Areas.
[3] According to CoreLogic MLS data


