


CoreLogic® Weather Verification Services captured wind and tornado footprints in California
A strong low-pressure system moved across California this week, bringing severe weather to the West Coast. The current storm system included heavy rainfall, compounding the rainfall totals from the atmospheric rivers that inundated the state in January and March. This weather event also brought near hurricane-force winds and even tornados, which are rare in California.
Severe Weather Continues to Batter California
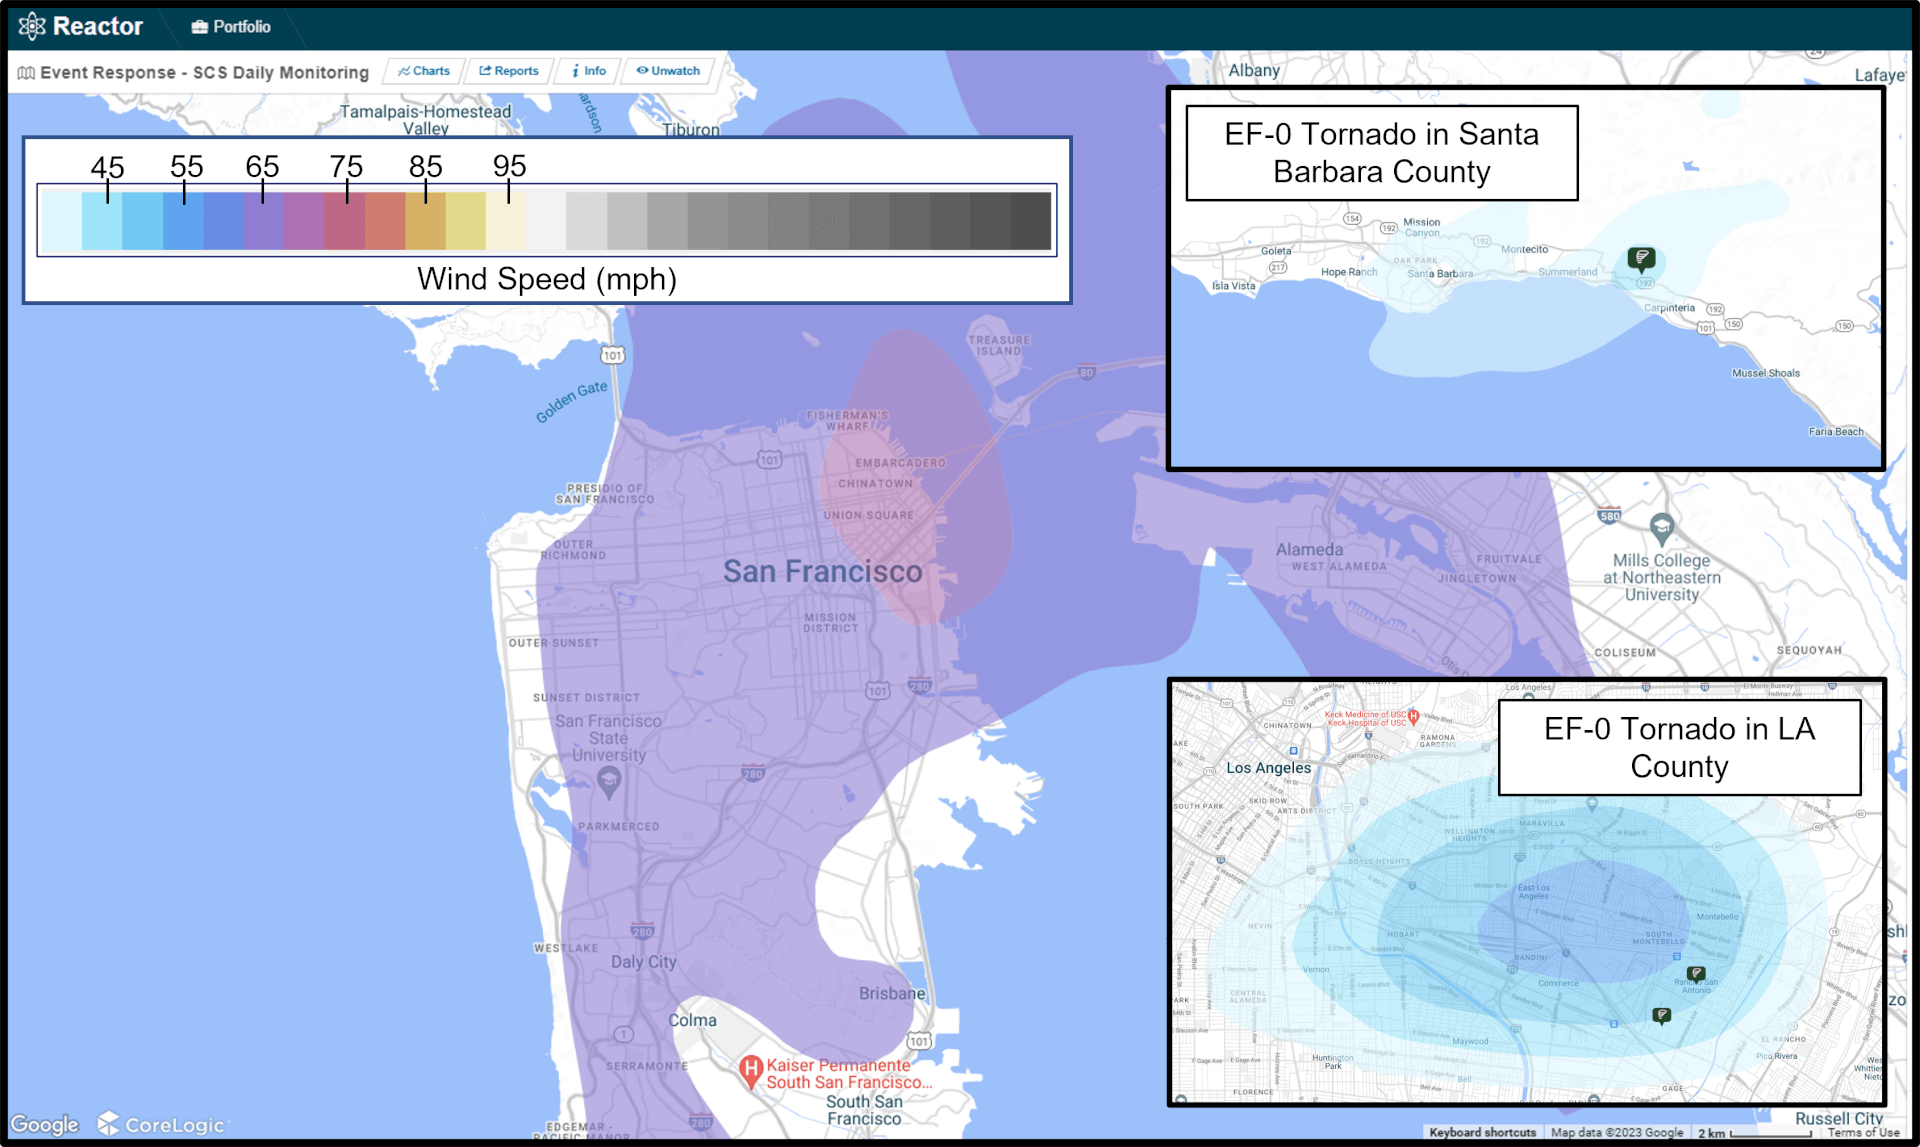
CoreLogic Weather Verification Services (WVS) captured the wind and tornado footprints resulting from the severe weather system. The footprints, as viewed in CoreLogic’s Reactor™ platform, are provided in Figure 1 below.
In downtown San Francisco, 75 mph winds were recorded between March 21-23. In central and southern California, two separate tornados were reported this week — the first being in Carpinteria, Santa Barbara County, on March 21, (Figure 1, top insert) and the second occurring in Montebello, Los Angeles County, on March 22 (Figure 1, bottom insert).
Figure 1: Wind and Tornado Footprints Captured by CoreLogic’s Weather Verification Technology as Viewed in Reactor™
Reports from across the state indicate that fallen tree limbs caused notable damage to homes and vehicles. Power outages occurred when fallen tree limbs snapped power lines.
According to the National Oceanic and Atmospheric (NOAA) Weather Prediction Center (WPC)’s storm report for March 22, 17 structures were damaged by the tornado in Montebello, California.
Low Risk Does Not Mean No Risk
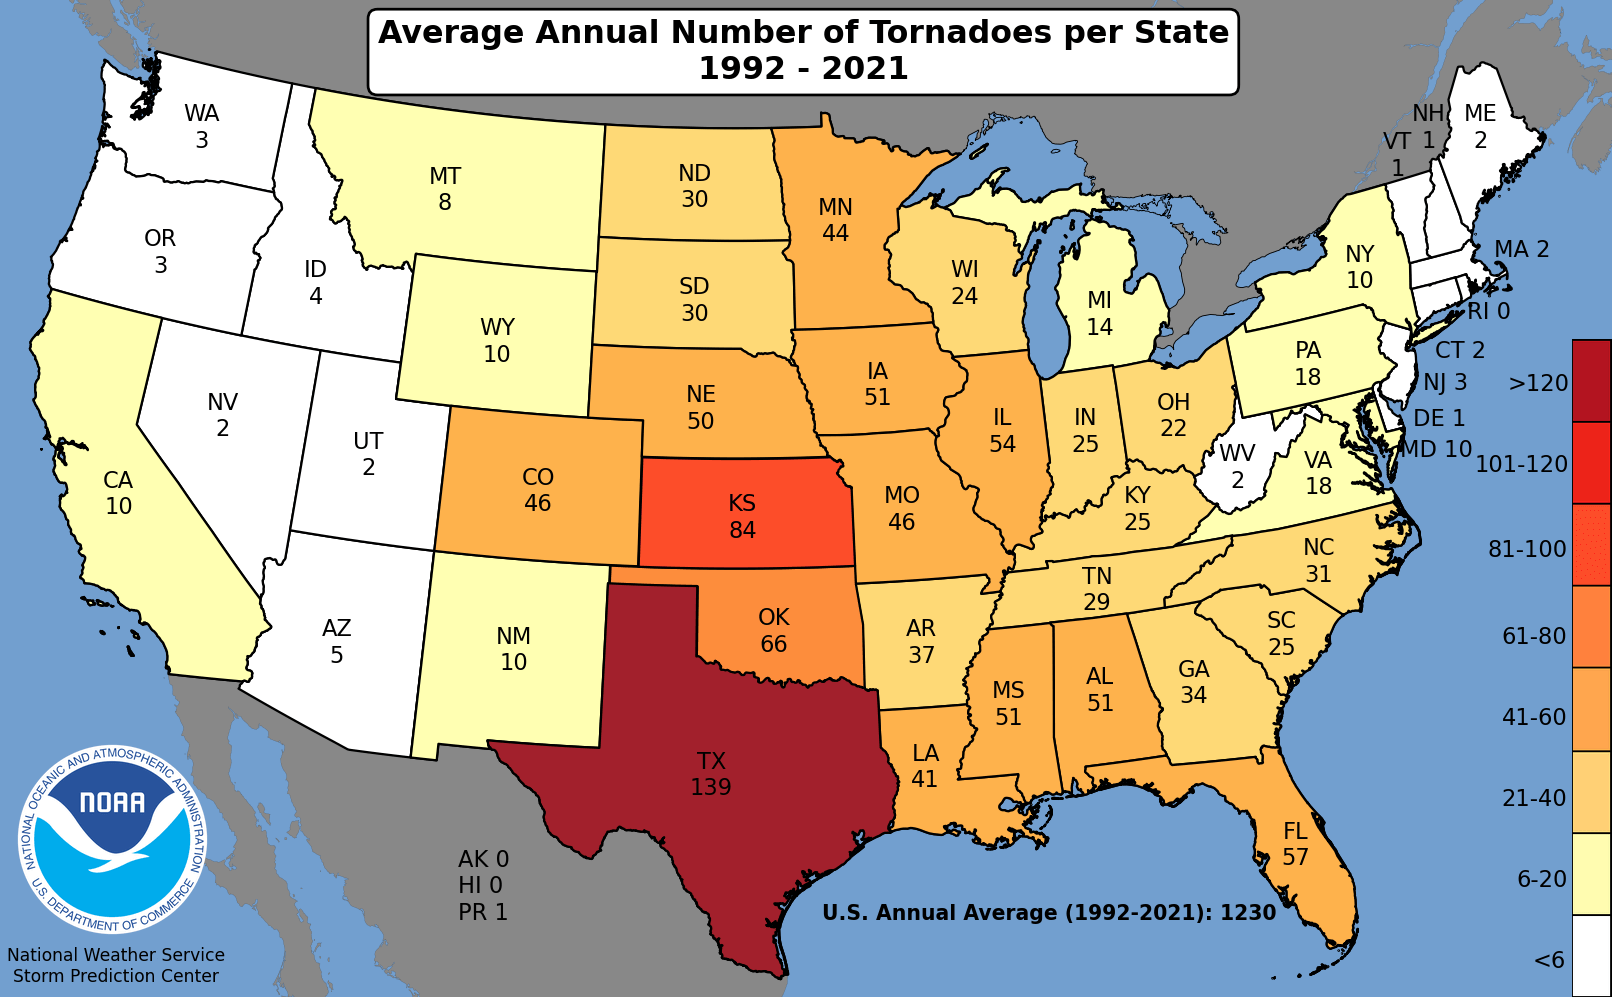
Tornado risk in California is significantly lower relative to other portions of the U.S., such as Texas, Kansas, Oklahoma and the Southeast. In 2023 alone, tornados destroyed homes in Harris County, Texas, and across Mississippi, Alabama, and Georgia. California, on the other hand, is typically spared from tornadic activity. According to the NOAA WPC, the average number of tornados per year in California is 10 (Figure 2). On the other hand, between 1992 and 2021, states such as Texas, Kansas and Oklahoma, which are infamous for tornadic activity, experienced an annual average of 139, 84 and 66 tornados, respectively.
Figure 2: Average Number of Tornados per Year (1992 – 2021) by State
Despite having low historic tornadic activity, California tornados have caused significant property and crop damage throughout recorded history. According to NOAA National Centers for Environmental Information (NCEI) Storm Events Database, the 469 tornados from 1951 to 2022 caused approximately $135 million in property damage and $1.5 million in crop damage. Per tornado, this translates to an average of almost $300,000 of total damage (property and crop combined). In 1983 and 1987, two tornados caused approximately $25 million in property damage each. These numbers have not been scaled to 2023 values accounting for inflation.
Visualize Hazard Footprints and Manage Your Portfolio With Reactor™
CoreLogic Reactor is an interactive, geospatial mapping solution that provides forecasting, as well as real-time and forensic weather data to users all from a single platform. Users can visualize storm warnings, watches and alerts, as well as impacts in the aftermath of activity. Such data includes tropical storm and hurricane wind speeds at the parcel level.
Wind speed and tornado footprints are powered by CoreLogic Weather Verification Services (WVS). CoreLogic WVS combines the best aspects of point observations — providing a high degree of accuracy — and radar technology (high-resolution patterns) using its proprietary algorithms to generate wind speed maps with neighborhood-level detail (500-meter resolution). These digital tools offer 100% coverage of the continental U.S.
Please email [email protected] with questions regarding the recent California severe weather or any CoreLogic Event Response notifications.
Visit www.hazardhq.com for updates and information on catastrophes across the globe.

