Borrower Equity Update: Fourth Quarter 2020
- Average equity gain of $26,300 per homeowner in 2020 was the highest in seven years.
- National negative equity share was 2.8% for the fourth quarter of 2020, the lowest in over 10 years.
National Home Equity Trends
The amount of equity in mortgaged real estate increased by $1.5 trillion in 2020, an annual increase of 16.2%, according to the latest CoreLogic Equity Report. The average annual gain in equity was $26,300 per homeowner — the largest average equity gain since the third quarter of 2013.
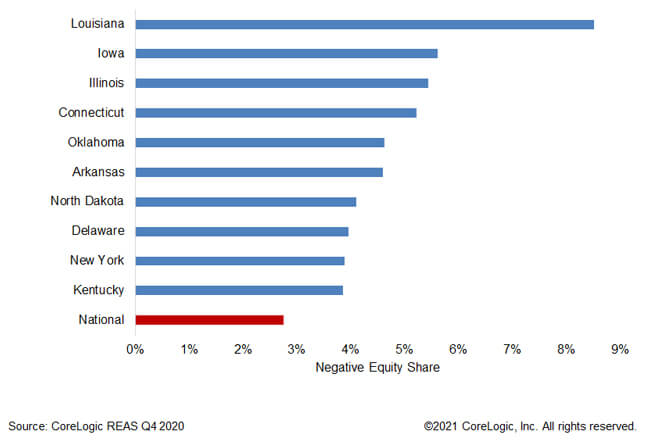
The nationwide negative equity share for the fourth quarter of 2020 was 2.8% of all homes with a mortgage, the lowest share of homes with negative equity since CoreLogic started tracking this number in the third quarter of 2009. The number of properties in negative equity decreased by 410,000 from the fourth quarter of 2019 to the fourth quarter of 2020.
Home prices soared in 2020, appreciating by the most since 2013 as buyers competed for a dwindling supply of homes for sale. The resulting home equity gains cushion homeowners from financial difficulties brought on by the pandemic and reduce the risk of foreclosure. Equity gains are likely to continue in 2021 as strong home-purchase demand is expected to remain high and continue pushing prices up.
State and Metro Level Home Equity
Figure 1 shows the ten states with the largest negative equity shares in the fourth quarter of 2020. Louisiana stands apart with 8.5% of mortgages with negative equity – more than three times the national average. Iowa (5.6%) and Illinois (5.4%) rounded out the top three states with the highest negative equity shares. States with high negative equity shares have experienced low home price appreciation compared with the national average. In addition, places with high negative equity shares are at higher risk for foreclosure and distressed sales.


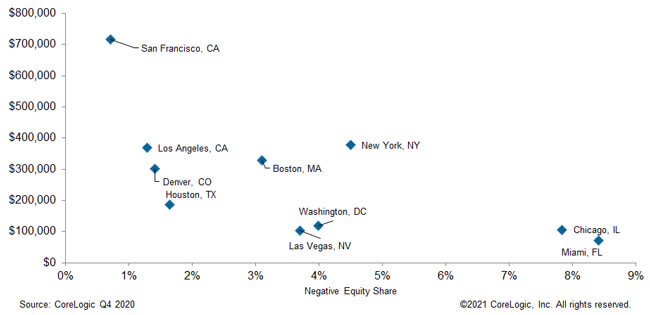
Negative equity shares vary greatly by metro area. Among the 10 large metro areas shown in figure 2, San Francisco had the lowest negative equity share (0.7%) and Miami the highest (8.4%). Figure 2 also shows that he average amount of negative equity is inversely related to the negative equity share. The average underwater amount in San Francisco was $715,000, more than 10 times the average underwater amount in Miami.
Home equity reached new highs in 2020 as home prices increased the fastest since 2013. This increase in home equity will buffer homeowners from hardships caused by the pandemic. For ongoing housing trends and data, visit the CoreLogic Insights Blog: www.corelogic.com/insights.
©2021 CoreLogic, Inc. All rights reserved.

