Climate risk models predict hurricanes and associated hazards will pose a greater risk to large metro areas
The word “hurricanes” conjures images of Florida, Texas, or Louisiana, where one consistently hears news projecting storm paths and damages. Scientifically, hurricanes are large, destructive, convective storm events, and climate risk models predict a rise in their frequency and severity. At the same time, multiple other weather related hazards are intensifying, creating associated and compounding risks.
Wildfire, inland flood, thunderstorms, and winter storms are hurricane-associated weather hazards — they too are impacted by changes in energy flows and water cycle patterns. These hazards may occur during hurricane season or they may occur in sequence (hurricane then wildfire), and one hazard may foster another. Excessive rainfall in a season can promote growth of vegetation, which then can turn into a stockpile of wildfire fuel from a dry season. CoreLogic® analytics show total predicted losses due to hurricanes in Florida and Texas to be heavily impactful on average, but data also show surprises in extremesi.
Increasing Risk to Take a 30% Bigger Bite of the $5T Big Apple
New York-Newark-Jersey City, NY-NJ-PA CBSA (Core Based Statistical Area or NYC area) is one of the most populated metropolitan areas in the world. The New York-Newark-Jersey City, NY-NJ-PA CBSA (NYC) also ranks No. 14 in the U.S. for number of properties (>117,000 properties) with extreme or extreme shifts in hurricane risk scores for hurricane wind or flood. New York is not known for tropical cyclone risk, but Superstorm Sandyii showed the city’s vulnerabilities.
The New York City area experiences Nor’easters, winter storms that are strongest and most frequent between September and April. The city also has thunderstorms in spring and summer with associated inland flooding. These hazards occur prior and coincident to hurricane season and can create saturated grounds or other damages that erode structural resiliency to hurricane impacts.
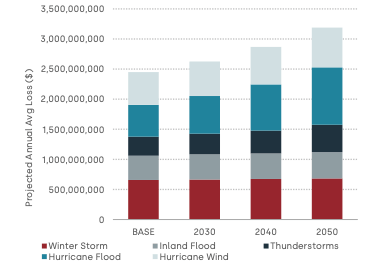
Exhibit 1iii shows the modeled projected annual losses due to hurricane wind, hurricane flood, winter storm, thunderstorms, and inland flood for 7 million properties in New York City, worth $5.0 trillion in total property value and $3.4 trillion in reconstruction cost. Total annual projected losses due to these five hazardous weather events are $2.5 billion at current (BASE) and $3.2 billion in 2050, up 30%.
Overlapping & Sequential Perils Need Holistic Resiliency Strategies
Data shows predicted annual losses for each peril — spanning the full year — rise with each time horizon in both frequency and severity, contributing to rising total predicted annual losses. Further, these perils can overlap with one another, forcing residents to juggle simultaneous disasters. Perils can also occur in sequence, while residents are still recovering from the last disaster and amplifying the second impact. These predictions for the severe weather events New York City already experiences will require holistic resiliency strategies to manage multiple associated and compounding climate risks.
Extreme Risk Properties, Worth $2.5B, Hurt by More Than One Peril
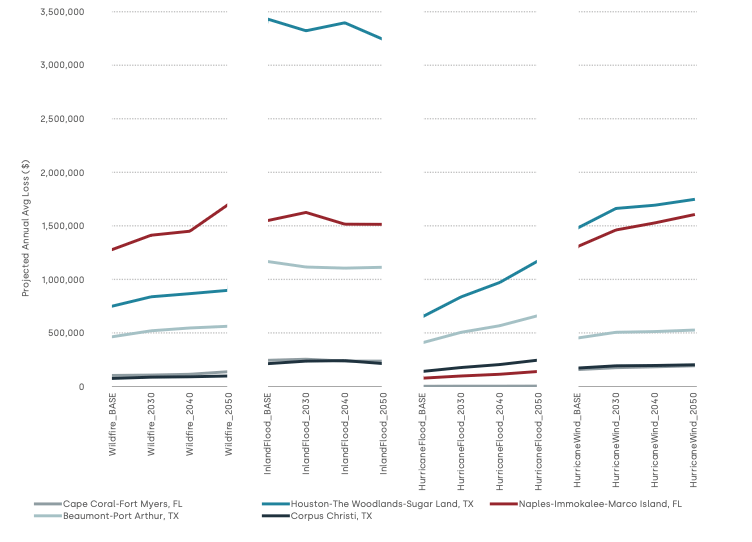
Coastal CBSA’s are exposed to hurricanes, but other perils are almost as impactful as hurricanes. Extreme Riskiv properties from top CBSA’s in all hurricane (wind, flood), wildfire, and inland flood are worth $2.5 billion in total property value and $1.2 billion in reconstruction cost. Examples below show the diversity across regions.
- The Naples-Immokalee-Marco Island area in Florida shows similar losses for wildfire, inland flood, and hurricane wind. Heavy rainfall from an active hurricane and thunderstorm season promotes vegetation growth, then the dry season can turn plants into wildfire kindlingv, as happened in the recent wildfire in Hawaii.
- Cape Coral – Fort Myers, only 45 miles north of Naples, shows a similar pattern but only 15% of the property count for multiple extreme risk properties. Granular geography matters.
- Climate change has morphed Texas’ fire season to year-round, but wildfire risk is more severe in winter (February through April) and summer (August through October). Winter fire season comes from cold fronts that bring dry air. Freeze-dried grasses and high winds increase wildfire severityvi.
- In the three Texas CBSA’s highlighted, inland flood losses are the largest of the four hazards. Floods come from wet weather that can grow vegetation and increase soil moisture levels, which in turn can decrease the ground’s capacity to absorb more water and creates more flooding.
Miami’s 2.7M properties, Worth $1.9T, Impacted by Multiple Associated Risks
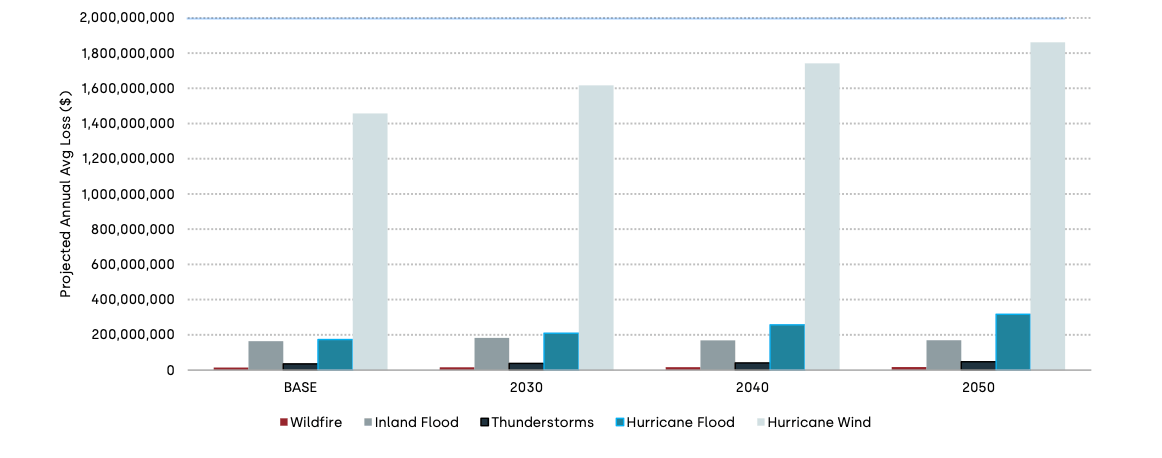
The CBSA of Miami-Fort Lauderdale-West Palm Beach, Florida ranks first or second nationally in the number of affected properties in every combination of perils with hurricane except those with a winter storm. CoreLogic data shows 2.7 million properties total in the Miami-Fort Lauderdale-West Palm Beach, FL CBSA worth $1.9 trillion in total property value and $697 billion in reconstruction costs seeing multiple associated climate risk impacts. Hurricane wind dominates these losses. Today’s $1.46 billion risk is projected to rise to $1.86 billion in 2050, a 28% increase.
Miami’s Extreme Risks Are Growing at 21%
CoreLogic data on multiple extreme-risk properties in Miami-Fort Lauderdale-West Palm Beach highlights the compounding impacts from hazards in that area that occur in spring, summer, and fall. Models predict 21% growth from current to 2050 in annual projected losses for these extreme risk properties. Projected losses due to wildfire are on par with hurricane wind, an unexpected result.
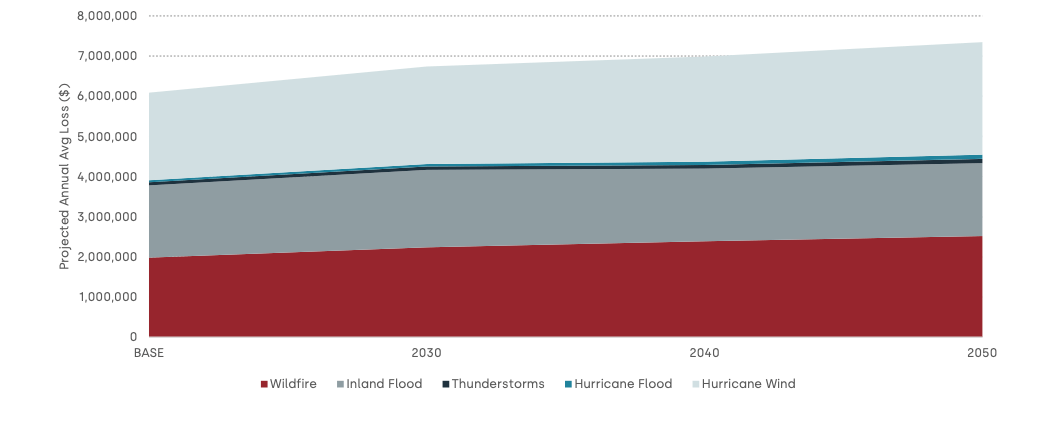
Exhibit 4: Miami-Ft Lauderdale-West Palm Beach CBSA projected annual average loss. Properties with extremes in all: Hurricane (flood, wind), wildfire, and inland flood
The Risk Is Not Only on the Coasts
Hurricane wind and rain does not stop at the coastlinevii. This is part of a popular misunderstanding that climate risks are mostly coastal.
Austin-Round Rock, Texas is about 200 miles inland from the Gulf of Mexico, yet hurricane wind is a hazard that is projected to cause $35 to $42 million in annual losses through 2050 for 1.5 million properties, an increase of 19%. These losses can compound and associate with wildfire, winter storm, thunderstorm, and inland flood as shown in Exhibit 5.
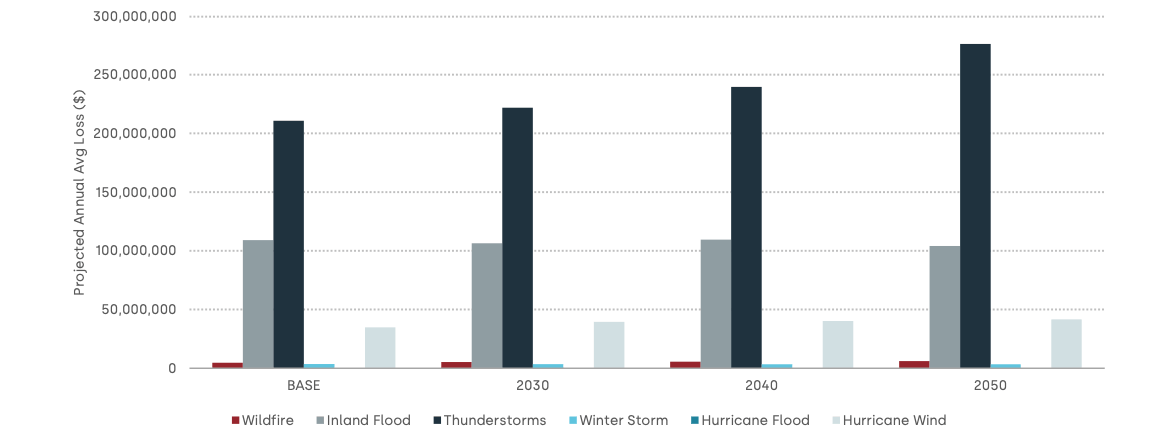
Exhibit 5: Austin-Round Rock, Texas CBSA projected annual average losses from hurricane (flood and wind), thunderstorms, inland flood, winter storm, and wildfire
Multiple, Intertwined Perils in NYC, Miami, Texas Need a Holistic Answer
Associated and compounding perils require holistic multi-peril management strategies because the hazards are not independent of one another and, in some cases, augment one another. They are not limited to coastal areas. Some properties in large metros satisfy extreme climate change criteriai for multiple hazards in addition to hurricane and are at the greatest risk — they show unexpected proportional losses amongst hazards when compared to the entire metro. Capacity to adjust to risk shifts in a timely manner is critical. New York City is in danger and Miami is in grave danger.
©2023 CoreLogic, Inc . All Rights Reserved .
CoreLogic and the CoreLogic logo are trademarks of CoreLogic, Inc . and/or its subsidiaries . All other trademarks are the property of their respective holders .
i A Hazard Risk Score>=70/100 or a shift in Hazard Risk Score >=40 points over any time frame for an individual property is deemed extreme, and this analysis combines extremes of multiple hazards to identify properties with extreme risk to climate change .
ii In 2012, Hurricane Sandy was one of the most-powerful storms to strike the most densely populated area of the United States, killing 160 people and causing over $65 billion in property damage . FEMA supplied more than $1.2 billion in housing assistance to over 174,000 survivors, more than $800 million was dedicated for debris removal and infrastructure restoration, and over $4.4 billion was paid in flood insurance claims. Impacts also included the flooding of the New York City Subway system and all road tunnels entering Manhattan except the Lincoln Tunnel, and The New York Stock Exchange closed for two consecutive days. https://www .fema .gov/blog/ remembering-hurricane-sandy-10-years-later
iii Total projected annual losses due to hurricane wind, hurricane flood, thunderstorm, winter storm, and inland flood at multiple time steps, Scenario 4.5 for 7 million properties in the New York-Newark-Jersey City, NY-NJ-PA CBSA
iv CoreLogic identified properties that satisfy extreme criteria for not only hurricane perils, but also satisfy extreme criteria for other perils. These are individual properties with peril risk score >=70/100 or shift in peril risk score >=40/100 in hurricane (either flood or wind) plus other perils. Exhibit 2 below shows results for the top CBSA’s by count for properties satisfying extreme criteria for all of the following perils: hurricane (flood or wind), wildfire, and inland flood.
v Wildfire season in Florida is from March to June, two seasons following hurricane season with the dry season of October to May in between.
vi High heat and extended drought conditions generate wildfires in summer . Droughts create fire risk as they dry timber, brush, grass, and surface vegetation, but risk also increases when growing seasons are wetter than average in Texas . When wetter weather is followed by drought, the higher fuel load drives increased wildfire risk (https://wfca.com/articles/texas-fire-season/#:~:text=When%20is%20the%20 Texas%20Fire,summer%20(August%20through%20October)
vii The intensity of rain and wind dampens as the storm moves over land and stops fueling from warm waters

