Monthly appreciation in February heated up beyond the typical seasonal uptick, pushing prices up by 0.6%
As with many economic indicators, the road to normalizing housing markets remains bumpy. While home sales and inventories are improving from last year’s bottom, higher mortgage rates continue to challenge affordability and keep many potential buyers on the sidelines. Despite new listings jumping by double digits in many markets, pending home sales activity is tracking about 5% to 7% higher through March compared with last year.
Overall, looking across housing markets indicators, including days on market and sales-to-list-price ratios, housing market trends are pretty similar to last year. This suggests that the stabilization of mortgage rates below the current levels and a slower rate of home price appreciation will be needed to further unthaw the market. Still, given the persistent imbalance between buyers and sellers, home price growth remains startlingly strong, as monthly gains move higher. Last spring, similar trends emerged with home prices heating up during the spring and normalizing afterward. CoreLogic’s Home Price Index (HPI) forecasts another year of gains averaging over 4% for the year.
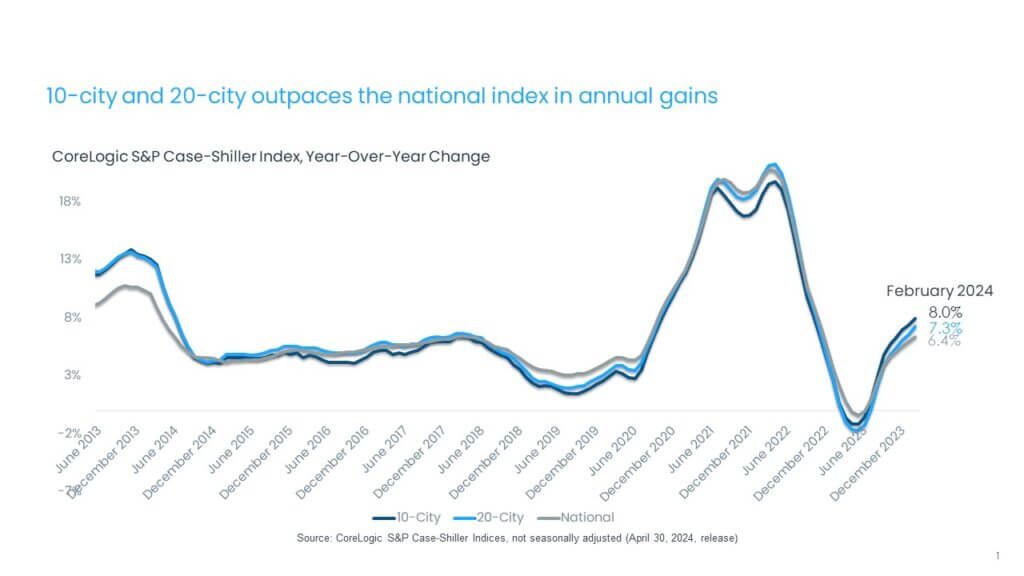
In February, the CoreLogic S&P Case-Shiller Index reaccelerated and recorded a 6.4% year-over-year gain, the eighth straight month of annual increases (Figure 1). With the rebound in appreciation in 2023, home prices are now up by 1.3% compared with the June 2022 peak.
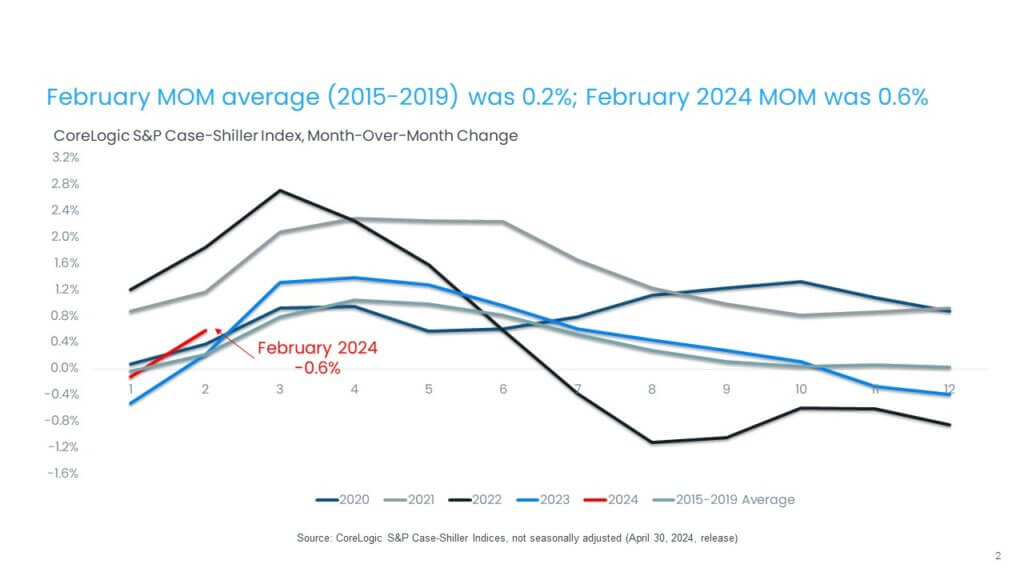
While high mortgage rates continue to impact sales activity, the non-seasonally adjusted month-over-month index jumped by 0.6%, considerably higher than the 0.2% increase recorded on average between 2015 and 2019 (Figure 2) in February. Even last spring, when home price growth heated up beyond the seasonal trend, February’s monthly increase was only 0.2%.
The 10-city and 20-city composite indexes also posted their eighth straight months of annual increases in February, up by 8% and 7.3%, respectively. The 10-city index includes currently better-performing metro areas such as New York and Chicago, which have seen relatively stronger housing markets since mid-2022, as the return to cities and offices continues. Many of these metros are catching up on home prices gains that pandemic-era boomtowns experienced during COVID-19. Among the top 100 largest metro areas, the five with the highest rate of home price appreciation this year are in Northeast, with most surrounding New York City, including Camden, New Jersey (up by 13%); Hartford, Connecticut (up by 12%); Syracuse, New York; Newark, New Jersey and Providence, Rhode Island, the latter three metros all posting 10%-plus annual increases.
Compared with the 2006 peak, the 10-city composite index is now 48% higher, while the 20-city composite is up by 55%. Adjusted for inflation, which is showing signs of easing, the 10-city index is now 1% higher than its 2006 level, while the 20-city index is up by 6% compared with its 2006 high point. Nationally, home prices are 15% higher (adjusted for inflation) compared with 2006.
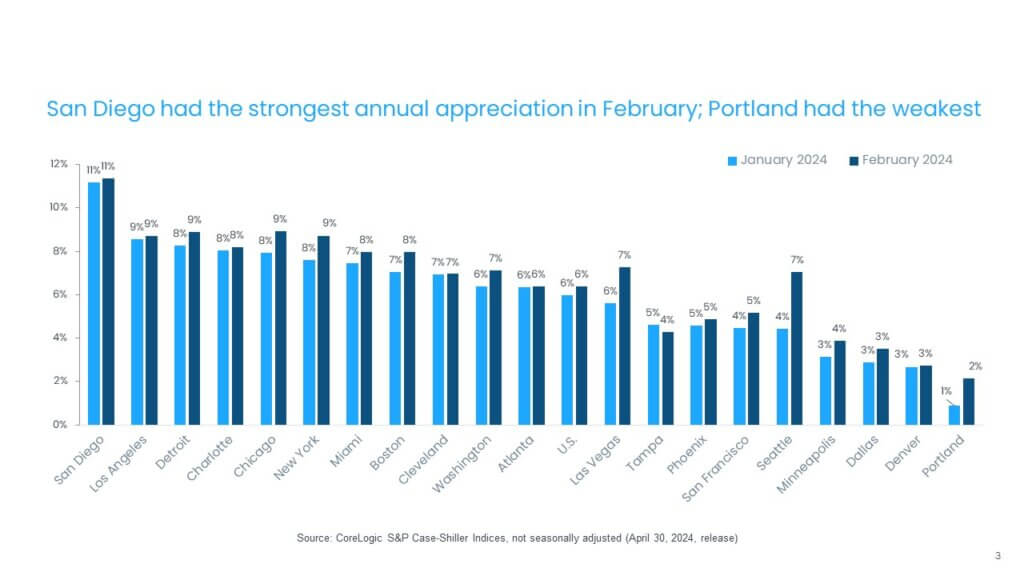
In February, 19 out of 20 metros saw faster price growth year over year compared with the previous month (Figure 3), though acceleration in annual gains continues to reflect a comparison with the home price trough in early 2023. Tampa, Florida was the only metro where annual gains slowed from the previous month.
San Diego, Chicago and Detroit continued to lead the 20-city index, with respective annual gains of 11.4% and 8.9% for the latter two. Twelve metros saw annual price gains higher than the national 6.4% increase. San Diego recorded the second month of double-digit annual increases in February.
The strongest annual price acceleration compared with the previous month was again mostly seen in the Western U.S. but also in Northeast, with Seattle, Las Vegas and New York topping the list.
Portland, Oregon remains the slowest appreciating market, up by only 2% compared with last year.
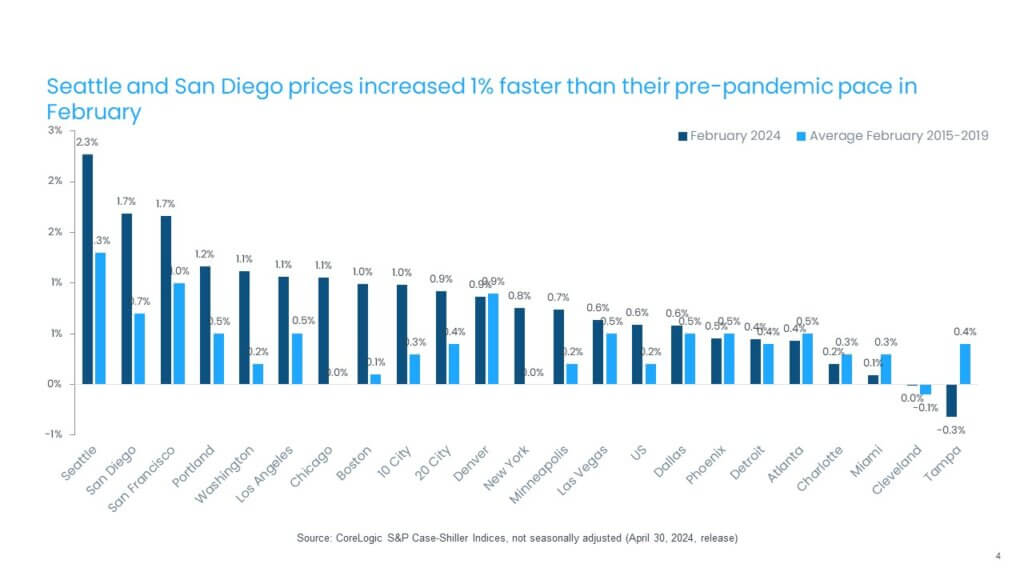
While home prices increased by 0.6% nationally from January to February, 16 metros recorded stronger monthly gains. Figure 4 summarizes the current year’s monthly changes in February compared with averages recorded between 2015 and 2019.
Seattle, San Diego and San Francisco posted the nation’s largest monthly gains, a respective 2.3% and 1.7% for the latter two. Tampa’s prices were down by 0.3% in February – making it the only market with a monthly loss. Tampa also saw a considerable increase in new listings this spring, which may be helping cool home price gains. Metros in the Midwest, including Cleveland and Detroit, which saw strength in home price growth in coming into 2024, continued to remain relatively cool in February. In general, more affordable Midwestern metros were harder hit with affordability challenges as mortgage rates remained elevated. Also, fast-appreciating Miami remains relatively soft this spring, as Florida in general is contending with not only high home prices but with the rising cost of homeowners’ and flood insurance (Figure 4).
The month-over-month comparison of appreciation by price tier and location also reveals relative changes in demand across the country. In February, most metros and price tiers saw home prices increase, in contrast to very muted conditions observed in the previous month. Tampa, again, was the only market where prices fell, particularly among higher-tier homes. High-tier home prices were on average up at the fastest pace, by 1%, while the middle tier was up by 0.9% and the low tier by 0.7%. Seattle’s middle and high tiers appreciated by more than 2.5% (Figure 5).

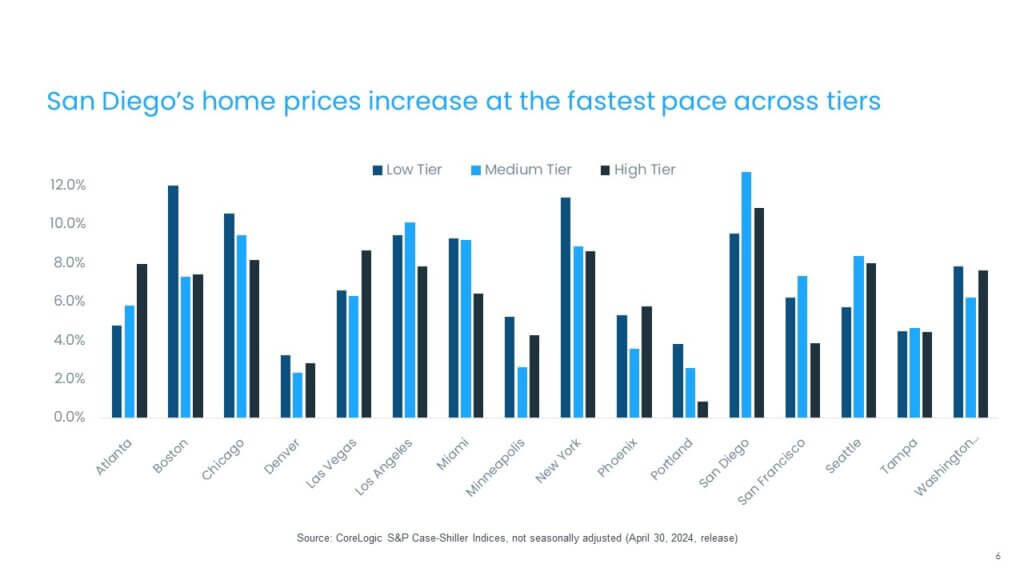
Over the course of the year, low-tier homes appreciated at the fastest pace, up by 7.2%, while high-tier homes prices grew by 6.5%. Overall, San Diego prices are up the most, thought low-tier homes in Boston, Chicago and New York lead the pace in appreciation of low-tier homes, up by 12% and 11% for the latter two, respectively (Figure 6).
While the S&P CoreLogic Case-Shiller Index continues to show home price resiliency amid surging borrowing costs, it also highlights continued headwinds for the housing market, namely affordability challenges for potential homebuyers due to rising home prices and elevated mortgage rates. In addition, with the skyrocketing costs of homeowners’ insurance and property tax increases, affordability challenges are even more prominent in areas that saw these additional costs of homeownership spike. In some of these places, rising costs are driving some existing homeowners to let go of their properties, particularly if these are second homes or investments.
©2024 CoreLogic, Inc. All rights reserved. The CoreLogic content and information in this blog post may not be reproduced or used in any form without express accreditation to CoreLogic as the source of the content. While all of the content and information in this blog post is believed to be accurate, the content and information is provided “as is” with no guarantee, representation, or warranty, express or implied, of any kind including but not limited to as to the merchantability, non-infringement of intellectual property rights, completeness, accuracy, applicability, or fitness, in connection with the content or information or the products referenced and assumes no responsibility or liability whatsoever for the content or information or the products referenced or any reliance thereon. CoreLogic® and the CoreLogic logo are the trademarks of CoreLogic, Inc. or its affiliates or subsidiaries. Other trade names or trademarks referenced are the property of their respective owners.

