Lack of availability of homes for sale has been the Achilles’ heel of many housing markets across the country even prior to 2020, and the COVID-19 pandemic has only exacerbated the shortfall.

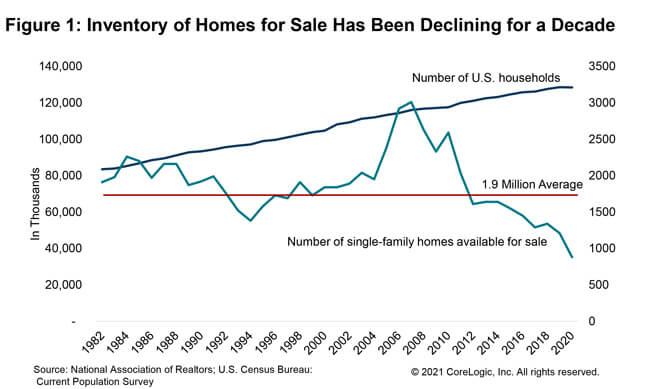
Since the Great Recession, the inventory of homes for sale has been on a decline and has reached its lowest recorded levels in recent months. From the 1980s to early 2000s, the annual number of homes for sale averaged 1.9 million. In 2020, the number fell below 1 million.[1] Over the same four decades, the number of households in the U.S. increased by about 44 million.[2]
But while the inventory decline was gradual pre-pandemic and averaged 10% year-over-year, it has since fallen to a 30% annual decline in the first quarter of 2021. As we move forward into peak spring home buying season, historical trends suggest that we will see an increase in new listings which generally peak in May and June.

According to CoreLogic ListingTrends, new for-sale listings jumped over 40% in April compared to 2020. Nevertheless, last year’s onset of the pandemic in March and widespread shutdowns in April and May upended housing market trends and led to a significant decline in inventory by as much as 50% compared to a year earlier. Thus, 2019 and 2018 trends may provide a more reliable benchmark in understanding the current housing market.

Unfortunately, despite the jump in new listings April inventory is still about 24% to 29% below 2019 and 2018 levels. Many markets with strong demand for homes have 40% fewer new listings today than in 2018, namely Kansas City, Dallas-Fort Worth, San Diego, Anaheim and Riverside, Phoenix, Austin, and Boise City, to name a few. Markets with relatively smaller declines, which average around 20% fewer new listings today than in 2018, include Naples, Port St. Lucie, and Fort Myers in Florida, Baton Rouge, Louisiana and Winston Salem, Asheville, and Greensboro in North Carolina.

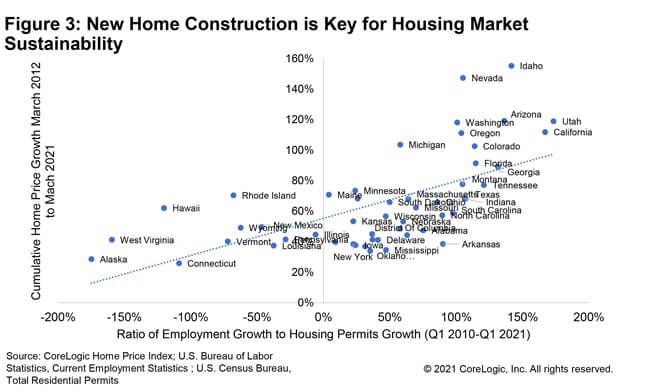
Moving forward, to find respite from the inventory shortage and the pressure it has created on home prices, we need to build more homes in areas where employment is growing and where people are moving. A look at the last decade of home prices, employment, and new home construction data shows that areas with the largest cumulative home price appreciation are the areas where employment gains outpaced new home construction growth.
©2021 CoreLogic, Inc. All rights reserved.
[1] National Association of Realtors: Number of single-family homes available for sale for United States
[2] U.S. Census Bureau: Current Population Survey (CPS) – America’s Families and Living Arrangements: Table HH-1 Households by Type

