GSE Patch accounted for an estimated $260 billion, or 16%, of 2018 home loan originations
Qualified Mortgage (QM) Overview:
The Consumer Financial Protection Bureau’s (CFPB) 2013 Ability-to-Repay (ATR) and Qualified Mortgage (QM) rule (Rule) requires lenders to make a reasonable, good faith determination of a consumer’s ability to repay a mortgage loan based on verified borrower financial information. Lenders who fail to comply can be held liable for damages by both the CFPB and the homeowner.
The Rule includes definitions of a Qualified Mortgage (QM) composed of “built-in” consumer protection features generally associated with responsible mortgage lending practices. In most cases a QM provides mortgage lenders with a conclusive safe harbor from the Rule’s legal liabilities. However, for higher-priced mortgage loans (HPMLs), a proxy for nonprime/subprime mortgage loans[1], the presumption can be rebutted by the homeowner on the basis that the lender did not leave the homeowner with enough “residual income” to cover basic living expenses after considering all current debt obligations. Non-QM loans do not provide the lender with protection from the Rule’s legal liabilities; it is ultimately a facts and circumstances judgment by a court in the event of litigation. However, CFPB has stated that so long as a lender can reasonably demonstrate borrower ability to repay, lenders ought not fear the Rule’s legal liability[2].
Loans meet the “General Definition” of QM if they possess the following features:
- Are not negatively amortizing, interest-only, or balloon loans
- Have a fully amortizing payment schedule with an interest rate that must remain fixed for the first five years of a term that cannot exceed 30 years, and is inclusive of all principal, interest, taxes, insurance, and other assessments
- Have a sum of points and fees that does not exceed 3 percent of the loan amount[3]
- The income and financial resources relied upon to qualify the borrower(s) are fully verified
- The ratio of monthly debt obligations to income cannot exceed 43 percent (“debt to income ratio,” or “DTI”). For this test, DTI must be calculated according to the Rule’s Appendix Q, which incorporates the FHA underwriting standards from 2013 for calculating debt and income.
In addition, mortgages that obtain insurance from the Federal Housing Authority (FHA), Veterans Administration (VA), or Rural Housing Service (RHS) are QMs by virtue of separate regulations issued by those agencies. The CFPB also provides certain special exemptions to small and rural lenders known colloquially as the “Small Creditor QM”[4].
Finally, the Rule also created a temporary category under which loans eligible for purchase or guarantee by Fannie Mae or Freddie Mac (the Government Sponsored Enterprises, or GSEs) qualify as QM loans. This exception, known as the “GSE Patch”, is scheduled to expire seven years after the effective date of the Rule (January 10, 2021) or earlier if the GSEs cease to be in conservatorship. In federal agency rulemaking terms, that is just around the corner as rulemaking timelines (including their industry implementation phases) can take up to two years or longer.
Meanwhile, mortgage industry stakeholders are buzzing over how the CFPB views the pending expiration of the GSE Patch. While robust policy dialogs on this topic will surely continue, the goal of our blog series is merely to offer some objective, third-party data and insights for stakeholders to consider in their discussions.
Sizing the 2018 GSE Patch-Eligible Market
CFPB’s primary goal for the GSE Patch[5] was to preserve access to credit for consumers during a period when mortgage markets were still in transition. CFPB was concerned that in the near-term certain features of the QM General Definition would lock-out certain consumers who can demonstrate ability-to-repay from the more liquid and credit-available QM markets, specifically:
- DTIs greater than 43%
- Financial characteristics, such as income streams that are inconsistent over time and particularly difficult to verify and calculate for DTI under Appendix Q[6] (Non-W-2 wage earners).

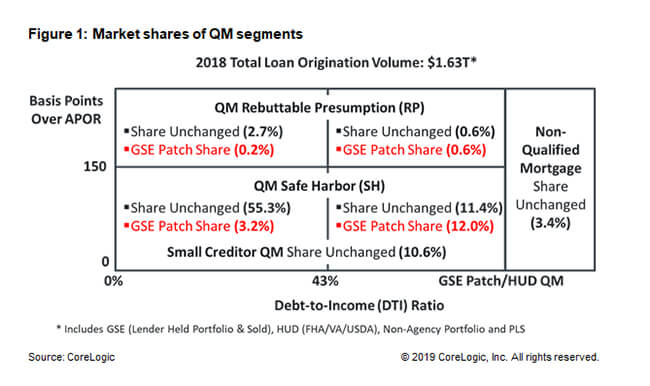
We take these two General Definition features into account when sizing QM segments, including GSE Patch-eligible segments[7]. Figure 1 displays the QM Safe Harbor and Rebuttable Presumption segments, based on APOR threshold[8] (Y-axis), cut by the QM General Definition’s 43% DTI threshold (X-axis). Non-W-2 wage earners (which include self-employed, part-time or “gig-economy” workers, seasonal workers, or retirees) are factored into each of the QM quadrants in Figure 1. No study to date that we’re aware of has quantified the extent to which lenders feel confident underwriting Non-W-2 wage earners to Appendix Q for QM-eligibility purposes (regardless of DTI ratio)[9]. Accordingly, and for the purposes of our analysis (subject to our upper and lower bounds as noted) we assume that all Non-W-2 wage earners eligible for QM in 2018 would not otherwise have been eligible in the absence of the GSE Patch.
Note that we also include the shares of Non-QM and Small Creditor QM loans to complete the sizing of the entire 2018 mortgage market.
2018 total mortgage loan origination volume is estimated to be $1.63T[10]. Using 2018 mortgage loan origination data we chart the market shares of all QM and Non-QM segments.
For each QM segment, Figure 1 displays the 2018 market share not impacted by the GSE Patch (in black), along with the share (in red) that we estimate was only QM-eligible in 2018 due to the presence of the GSE Patch. We estimate that roughly 16% (sum of all segments highlighted in red) or $260B in 2018 total loan origination volume was QM-eligible solely due to the GSE Patch. In other words, if the GSE Patch had expired at the beginning of 2018, $260B of 2018 mortgage loan origination volume would have had to have been originated as Non-QM loans, as they would not have been QM-eligible.
Importantly, we caveat that this rough order of magnitude estimate has an upper and lower bound range of $200B to $320B. While that is indeed a large swing, the ultimate point remains the same, a significant share of 2018 mortgage loan origination volume would have been impacted by the GSE Patch’s expiration, all things equal.
Deconstructing the GSE Patch:
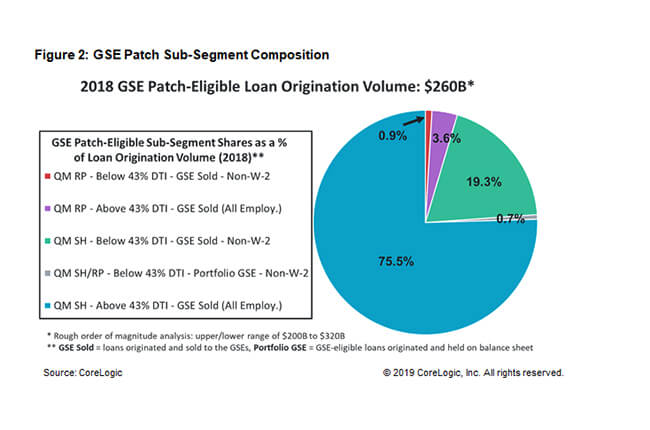
Once we pegged our 2018 GSE Patch market share and annual loan origination volume at roughly 16% and $260B respectively (with all due caveats on estimate range), we turned our attention to examining additional characteristics that account for mortgage loans being QM-eligible solely due to the GSE Patch (sub-segments). Figure 2 provides a further breakdown of GSE Patch loan sub-segments.

Figure 2 demonstrates the sub-segments of GSE Patch loans and their shares as a percentage of total GSE Patch-eligible loan origination volume. Notably, the sub-segment with the greatest percentage share (75.5%) was QM Safe Harbor loans, with DTI ratios above 43%, originated and sold to the GSEs, and covering borrowers of all employment types (both W-2 and Non-W-2 wage earners).
It also noteworthy that the second largest sub-segment (19.3%) was QM Safe Harbor loans, with DTI ratios below 43%, originated and sold to the GSEs, covering Non-W-2 wage earner borrowers. To the extent CFPB’s original concern regarding lender discomfort underwriting Non-W-2 wage earner borrowers to QM using Appendix Q was accurate, GSE Patch-equivalent volume at stake is significant.
Our next blog will empirically demonstrate the various profiles of borrowers that compose the largest GSE Patch sub-segment in recent vintage years, who will likely switch to the Non-QM segment following the GSE Patch expiration, all things equal.
[1] Higher-Priced Mortgage Loans (HPMLs) have an Annual Percentage Rate (APR) greater than or equal to the Average Prime Offer Rate (APOR) plus 150 basis points. APOR is a daily market index of the lowest APR offered by a selection of lenders across several mortgage products. FHA has a separate definition for its QM HPML, which is a higher APOR threshold than CFPB’s.
[2] See https://www.consumerfinance.gov/about-us/newsroom/prepared-remarks-of-richard-cordray-at-the-nafcu-annual-conference/
[3] Includes all origination points and fees retained by the creditor (lender), broker, or a lender-affiliated third-party services/settlement provider, with certain exceptions.
[4] See CFPB ATR/QM Assessment Report, January 2019, Page 208 at https://files.consumerfinance.gov/f/documents/cfpb_ability-to-repay-qualified-mortgage_assessment-report.pdf
[5] See CFPB ATR/QM Assessment Report, January 2019, Pages 23 to 28 at: https://files.consumerfinance.gov/f/documents/cfpb_ability-to-repay-qualified-mortgage_assessment-report.pdf
[6] See CFPB ATR/QM Assessment Report, January 2019, Pages 11, 13, 200, 201, 260, 261 https://files.consumerfinance.gov/f/documents/cfpb_ability-to-repay-qualified-mortgage_assessment-report.pdf
[7] QM segment market share analysis is a rough order of magnitude calculated using a compilation of the what we believe are the best empirical data assumptions our team is aware of. It is not a statistically valid representation.
Sources for analysis: CoreLogic at: https://www.corelogic.com/blog/2019/03/characteristics-of-todays-non-qualified-mortgages.aspx, Urban Institute at: https://www.urban.org/research/publication/what-if-anything-should-replace-qm-gse-patch, Urban Institute May 2019 Chartbook at: https://www.urban.org/sites/default/files/publication/100299/may_chartbook_2019.pdf, CFPB ATR/QM Assessment Report, January 2019 at https://files.consumerfinance.gov/f/documents/cfpb_ability-to-repay-qualified-mortgage_assessment-report.pdf
[8] The HPML/APOR threshold’s role in QM legal liability will be a focus of future blogs and is included in Figure 1
[9] CFPB ATR/QM Assessment Report, January 2019 discusses lender perceptions of Appendix Q with respect to underwriting Non-QM loans, which we feel is too small and selective a portion of the 2018 market to comfortably infer more broadly when estimating impacts on QM underwriting. However, we account for any discrepancies in our estimate range. See pages 153-155 at https://files.consumerfinance.gov/f/documents/cfpb_ability-to-repay-qualified-mortgage_assessment-report.pdf
[10] Mortgage Bankers Association (MBA) Mortgage Finance Forecast, May 2019 at https://www.mba.org/news-research-and-resources/research-and-economics/forecasts-and-commentary/mortgage-finance-forecast-archives
© 2019 CoreLogic, Inc. All rights reserved.


