Insights on balancing risks (loan delinquency) and benefits (mortgage credit access) in the QM Safe Harbor, following expiration of the GSE Patch
This blog is a continuation of Parts I-III of our blog series: Expiration of the CFPB’s Qualified Mortgage “GSE Patch.” As we introduced in Part I, mortgage loans tend to fall into one of the following compliance categories:
- QM Safe Harbor loans are foundational mortgage products (e.g., 5/1 ARM and 30-year fixed) that are generally considered to have sustainable borrower repayment features.
- QM Rebuttable Presumption loans generally have higher Annual Percentage Rates (APRs) than Safe Harbor loans and require extra steps by lenders to ensure borrower repayment sustainability.
- Non-QM loans are more complex mortgage loans, such as negatively amortizing mortgages.
These categories matter to mortgage borrowers as they bear on the balance between borrower repayment sustainability and mortgage credit access, since QM Safe Harbor loans have objectively composed the predominant share of annual mortgage lending volume.[1]
This blog will offer insights on balancing risks (loan delinquency) and benefits (mortgage credit access) in the QM Safe Harbor, following expiration of the GSE Patch. Our evidence base consists of merged CoreLogic Loan-Level Market Analytics (LLMA) data with Home Mortgage Disclosure Act (HMDA) data. We then created a cohort of home-purchase loans using 2010-2017 loan vintages.[2]
As noted in Part I, Conventional loans[3] are deemed QM Safe Harbor if they have an APR less than the Average Prime Offer Rate (APOR) plus 1.5%. APOR is a weekly market index of the average Conventional loan APRs offered by a selection of lenders across several mortgage products. Notably, FHA has a different definition for QM Safe Harbor, which is an APR less than the APOR plus (roughly) 2%.[4] The difference between a loan’s APR and the APOR is referred to as the “rate spread.”

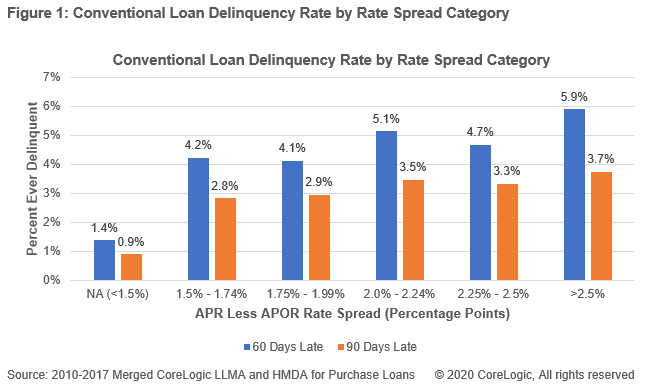
Figure 1 demonstrates that, across key loan delinquency measures (a proxy for borrower repayment sustainability), loan delinquency increased as rate spread increased. The percentage of loans that have ever been 60 days late in the below 1.5% rate spread category was 1.4% as compared to roughly 4.1% or higher for the 1.5% and above rate spread categories.[5] Part V of our blog series will seek to validate this loan delinquency pattern using 2018 LLMA data merged with HMDA data, which allows for more granularity when analyzing the below 1.5% rate spread category.
Notably, Figure 1 also demonstrates that there was little distinction in loan delinquency between the 1.5% – 1.74% and the 1.75% – 1.99% rate spread categories. These results suggest that there is a relationship between rate spread (loan pricing) and borrower repayment sustainability for Conventional loans that warrants closer investigation, including whether or not a 1.5% over APOR QM Safe Harbor cap is any more indicative of borrower repayment sustainability than a 2.0% over APOR cap, all things being equal.


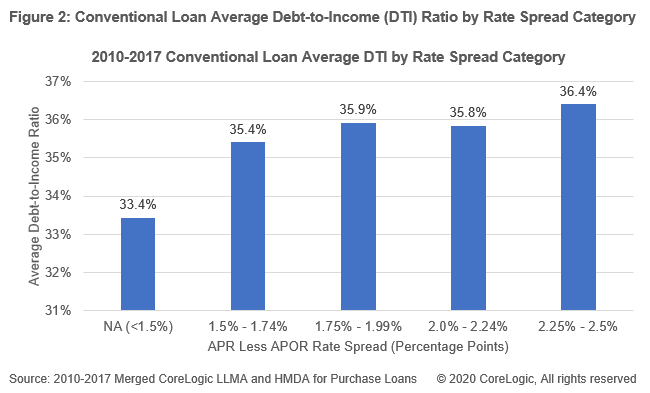
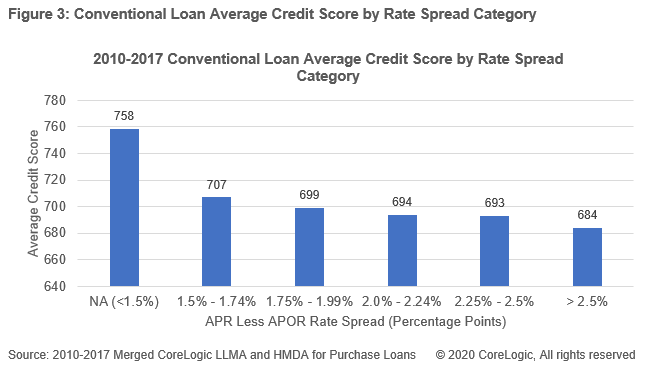
Of course, Conventional loan pricing does not exist in a vacuum. Figures 2 and 3 offer insights into the influence that multiple borrower ability-to-repay (capacity)-related underwriting criteria, such as DTI and Credit Score, exerted on rate spreads and loan delinquency. The quality of Conventional loan borrower DTIs and Credit Scores tracked almost completely in line with Conventional loan performance across all rate spread categories (i.e., as underwriting attributes deteriorated, the rate spread (loan pricing) and borrower loan delinquency both increased). These results merely reinforce the importance of borrower ability-to-repay-specific underwriting policies[6] when defining a new ATR/QM Rule, following expiration of the GSE Patch.
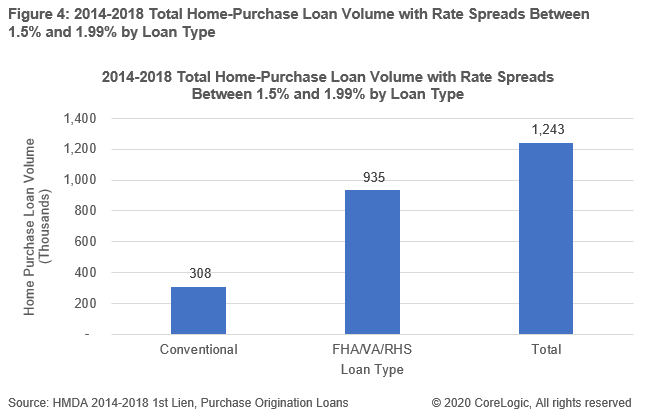
Finally, to the extent Figures 1-3 provide insights into borrower repayment sustainability “risks” of increasing the rate spread cap for QM Safe Harbor loans, all things being equal, Figure 4 seeks to offer insight into the potential mortgage credit access “benefits” for borrowers.

Figure 4 demonstrates that, between 2014-2018, about 627,000 more first lien, purchase loans were originated under the FHA, VA, and RHS loan programs than under Conventional loan programs in the 1.5% to 1.99% rate spread category. Conventional loans in this rate spread category are deemed QM Rebuttable Presumption loans, while FHA, VA, and RHS loans are deemed QM Safe Harbor. This delta represents 3% of the roughly 20.9M first lien, purchase loans originated over that time period. This evidence is not dispositive as to how many incremental Conventional loans would have been originated in the 1.5% to 1.99% rate spread category had these loans been deemed QM Safe Harbor. However, given the outsized overall market share of QM Safe Harbor loans, it stands to reason that the more permissive FHA QM Safe Harbor cap of roughly APOR plus 2.0% (along with the lack of an APOR cap in the VA and RHS programs altogether) increased mortgage credit access for applicants with APRs in this rate spread category (935,000 loans), particularly when compared to the QM Rebuttable Presumption compliance status for Conventional loans in this same rate spread category (308,000 loans).
Policymakers ultimately have difficult judgment calls to make with respect to striking a balance between borrower repayment sustainability and mortgage credit access. All things equal, do the benefits of incremental mortgage credit access resulting from an increased QM Safe Harbor rate spread cap for Conventional loans outstrip the risk of increased loan delinquency rates for Conventional loan borrowers? And with the GSE Patch expiring, what is the proper role for ability-to-repay-specific underwriting criteria in a new ATR/QM Rule? These judgments become particularly relevant in the event our economy experiences a recession, placing upward pressure on delinquency rates.
Our next blog will look at 2018 merged CoreLogic Loan-Level Market Analytics (LLMA) and HMDA data to validate our findings and uncover additional insights.
[1] See https://www.corelogic.com/blog/2019/07/expiration-of-the-cfpbs-qualified-mortgage-gse-patch-part-1.aspx
[2] CoreLogic Loan-Level Market Analytics (LLMA) data was merged with 2010-2017 HMDA data by employing a unique matching technique that linked LLMA loan performance data to HMDA origination data. The match was based on loan characteristics, such as the loan amount, the loan purpose, the loan type, census tract, origination year, and the lender identity key. The overall match rate was about 50% of the LLMA data. Performance of loans were tracked as of October 2019.
[3] Conventional loans are not insured or guaranteed by a federal government program (such as FHA, VA, and RHS). They include both GSE conforming and non-conforming product.
[4] By statute, FHA, VA, and RHS each define QM for their respective lending programs, including any rules that distinguish QM Safe Harbor loans from QM Rebuttable Presumption loans. Under the current FHA QM rule, QM Safe Harbor is defined as an APR less than the APOR plus the ongoing FHA Mortgage Insurance Premium (MIP) plus 1.15%. While the MIP is a variable premium (based on certain loan features) that ranges between 45 basis points (0.45%) up to 105 basis points (1.05%), the large majority of FHA loans have a MIP of 85 basis points (.85%). Accordingly, for the purposes of this discussion, we assumed that the FHA cap for QM Safe Harbor was roughly APOR plus 2%. APOR is not a factor in the VA and RHS QM Safe Harbor definitions and, with few exceptions, virtually all VA and RHS loans were QM Safe Harbor.
[5] It is important to note that HMDA did not require reporting of rate spreads below 1.5% until 2018. As such, performance of rate spread in the <1.5% category reflects aggregate data for all loans with an APR less than APOR plus 1.5% and cannot reflect a more granular default slope across rate spread buckets below that level. However, our next blog will explore 2018 merged data and how that bears on our analysis.
[6] Underwriting criteria refers not only to the lender/investor’s underwriting criteria “thresholds” themselves (e.g., maximum allowable DTI of 45% with a Credit Score of at least 720), but also the methods by which lenders fully verify (i.e., ensure the veracity of) borrower financial resources, as well as consider the types of financial resources and their amounts to include in the underwriting criteria’s calculation (e.g., use of an IRS form W-2 to verify the borrower’s income and determine the amount of annual bonus income to factor into the monthly DTI ratio calculation).
© 2020 CoreLogic, All rights reserved


