How homebuyers time a purchase is often tied to reading the market. Real estate markets over the past two decades have often followed economic booms and busts, and buying a home at a particular time could be a crucial factor in owners’ financial futures.
Purchasing a property before an economic downturn could result in a substantial decrease in home equity, since values in such times typically decline but borrowers’ debts remain the same. On the other hand, buying a home before prices rise again can help build exceptional amounts of equity.
Mortgage rates also play a huge role in personal wealth: Purchasing a property when rates are low can result in significant savings via lower monthly payments, which in turn helps increase wealth accumulation via other assets. Of course, there is no certainty surrounding future home prices or interest rate hikes, so the differences in housing wealth sometimes comes down to luck.
Borrowers Who Purchased 20 Years Ago Have Almost Three Times the Equity as Current Borrowers
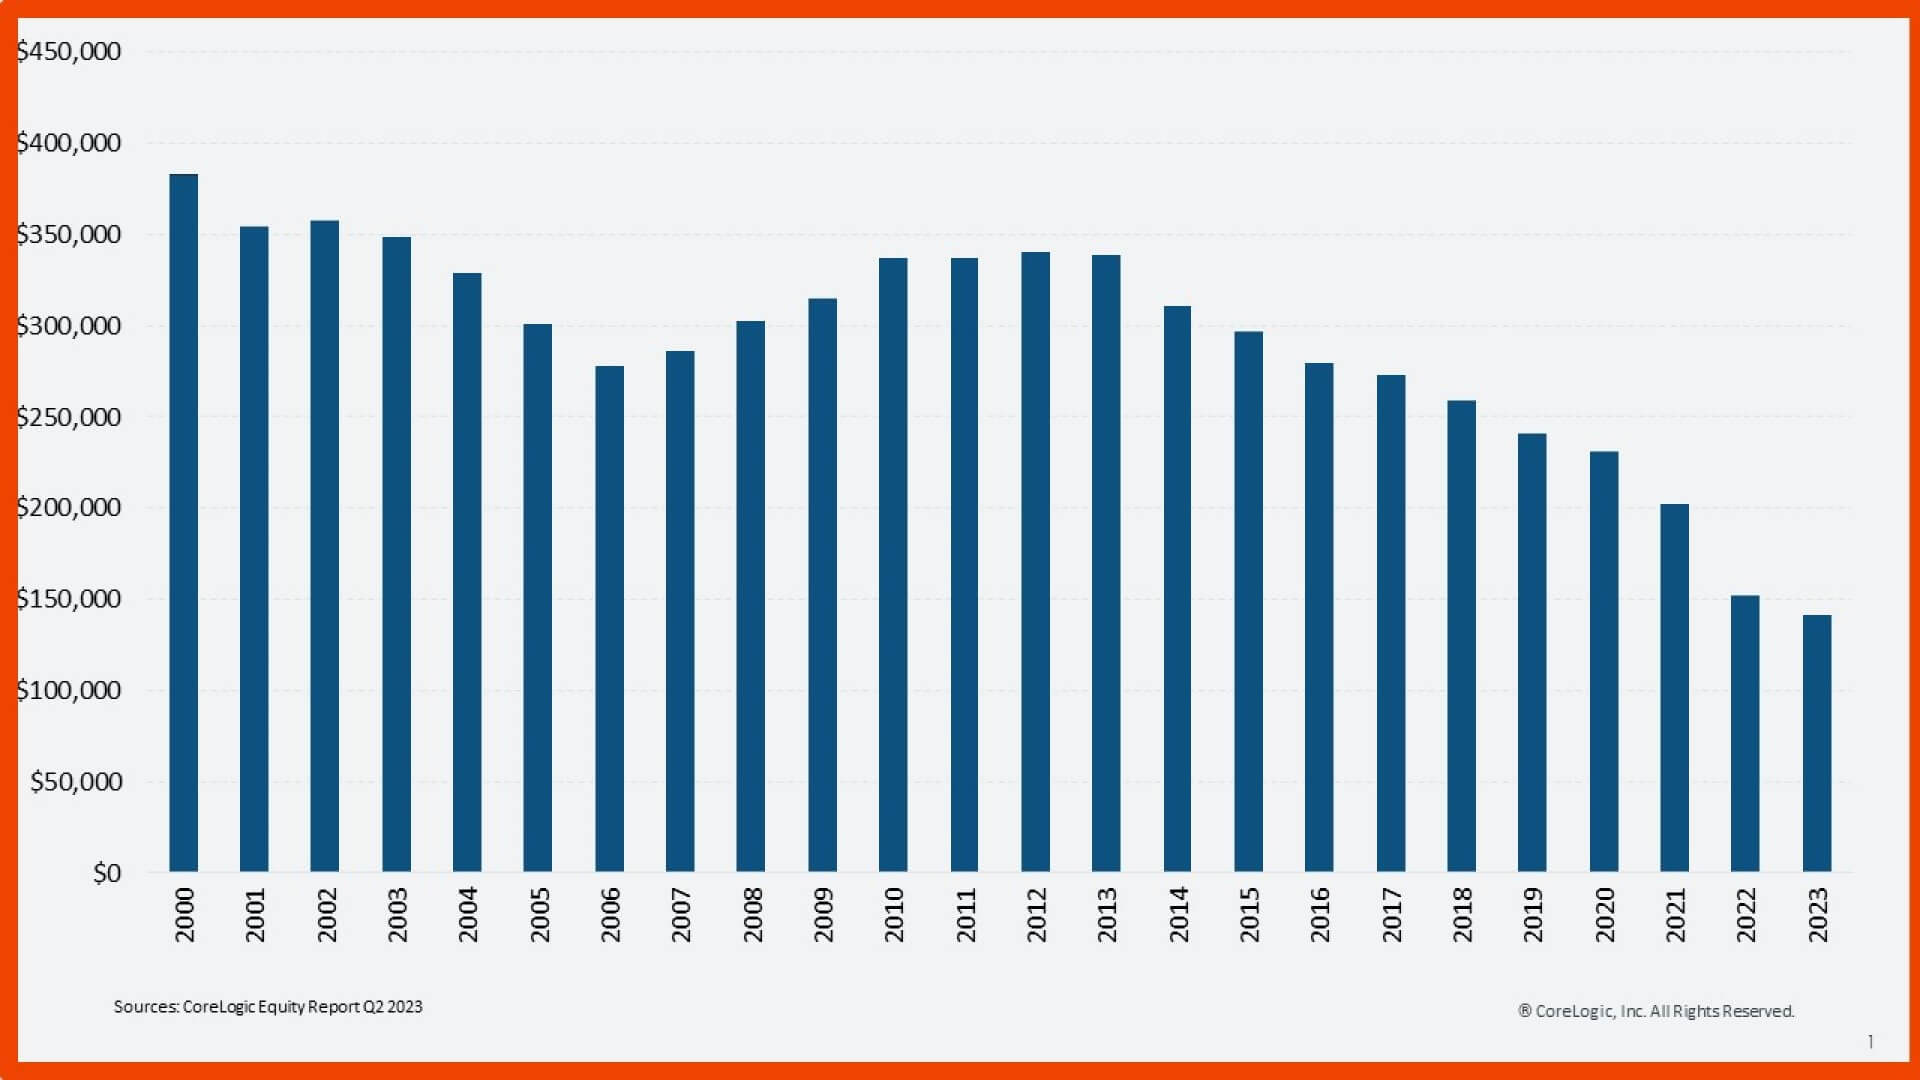
Figure 1 illustrates the difference in home equity that the average U.S. borrower had as of June 2023 by year of purchase. Longer-term borrowers have more equity because they have been making payments for an extended period and thus have smaller monthly mortgage bills. When rates were lower, homeowners with mortgages had more opportunities to refinance and restructure. The result is that a U.S. home bought in 2000, on average, has $382,000 in equity compared with $141,000 for a property purchased in 2023.

The specific timing of a home purchase can make a substantial, long-lasting difference in equity. As also shown in Figure 1, homes purchased in 2006 have less equity than those purchased from 2007 to 2018.
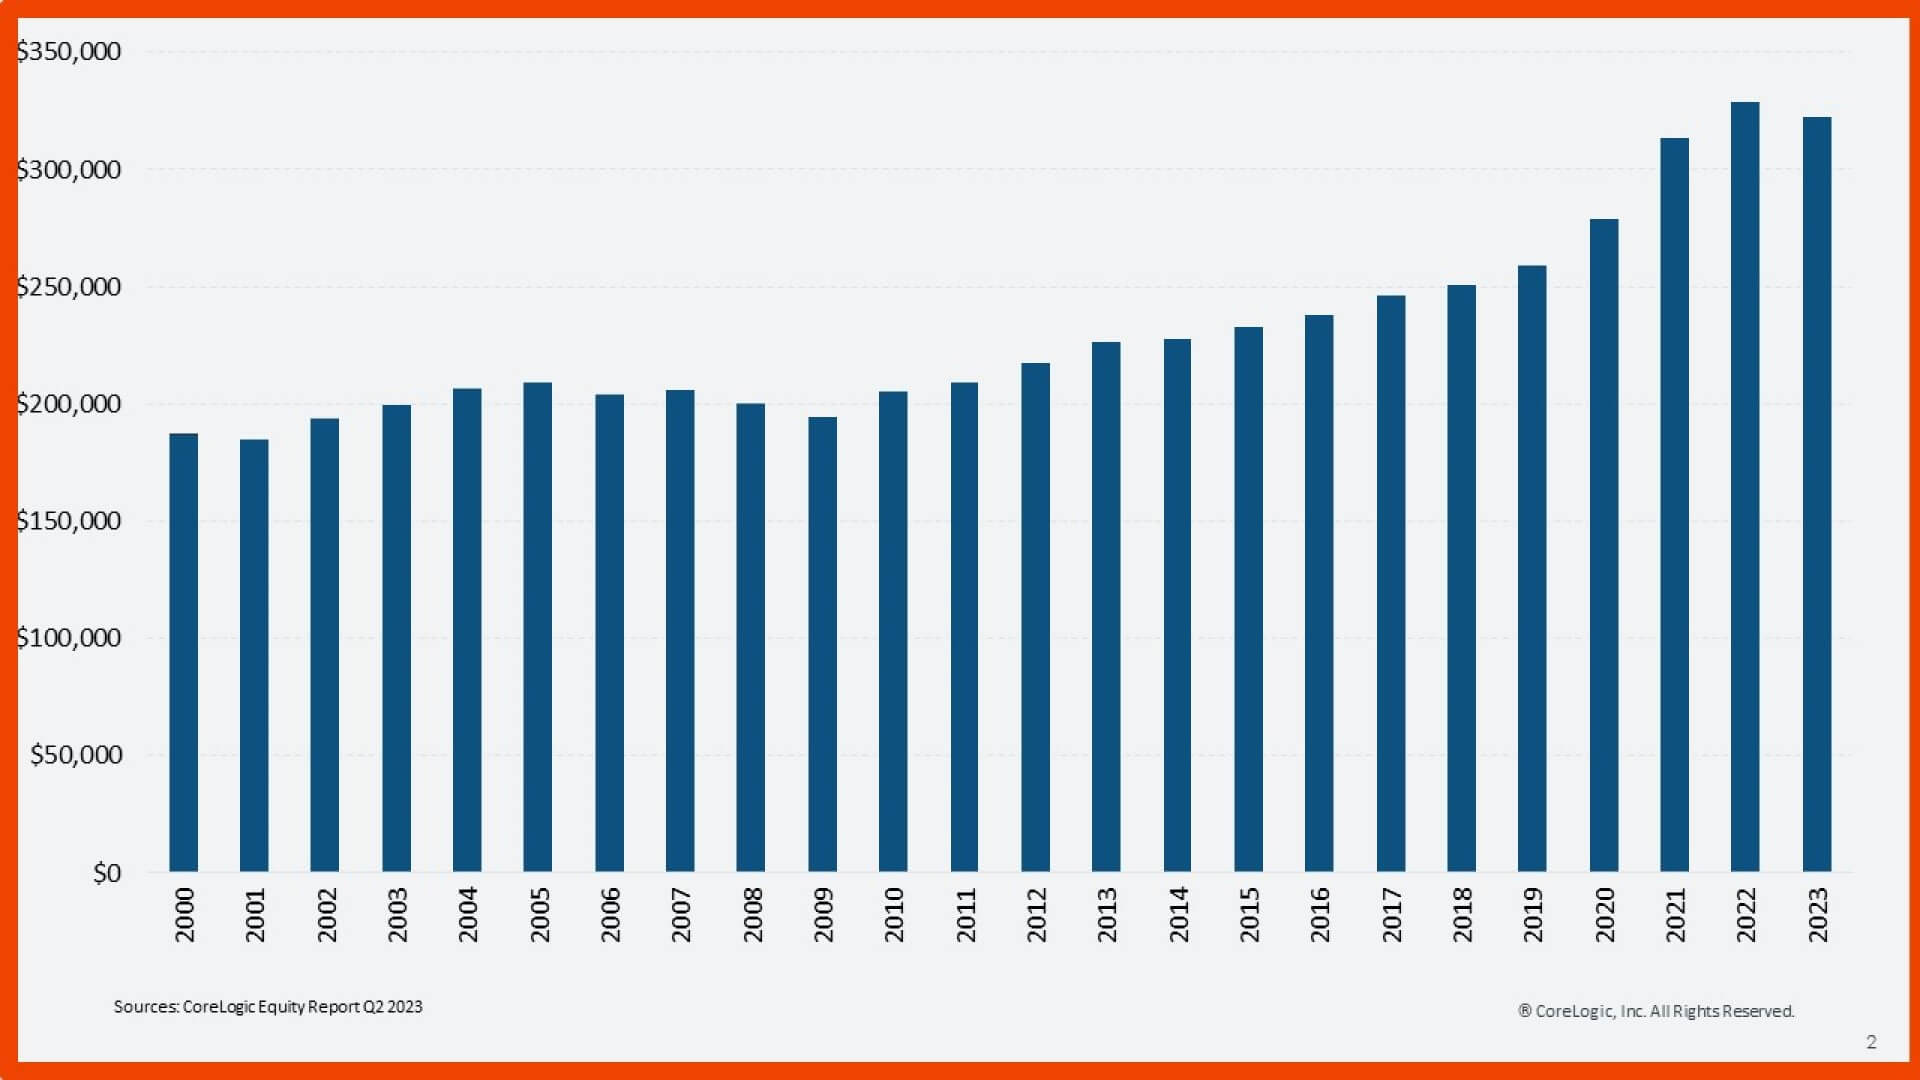
Figure 2 shows the average outstanding amount left on a mortgage by year and illustrates why the situation is slightly more complex. On average, a borrower who bought in 2006 will still have a higher remaining mortgage balance than someone who bought a home between 2007 and 2010. This is because 2006 homebuyers likely paid more for the same home than 2007 buyers, thus requiring a larger mortgage. And since these buyers’ prices began to quickly fall after their purchase, they are more likely to have fallen into negative equity at some point, which limits the opportunity to refinance.

Examining Home Equity Trends in Los Angeles County
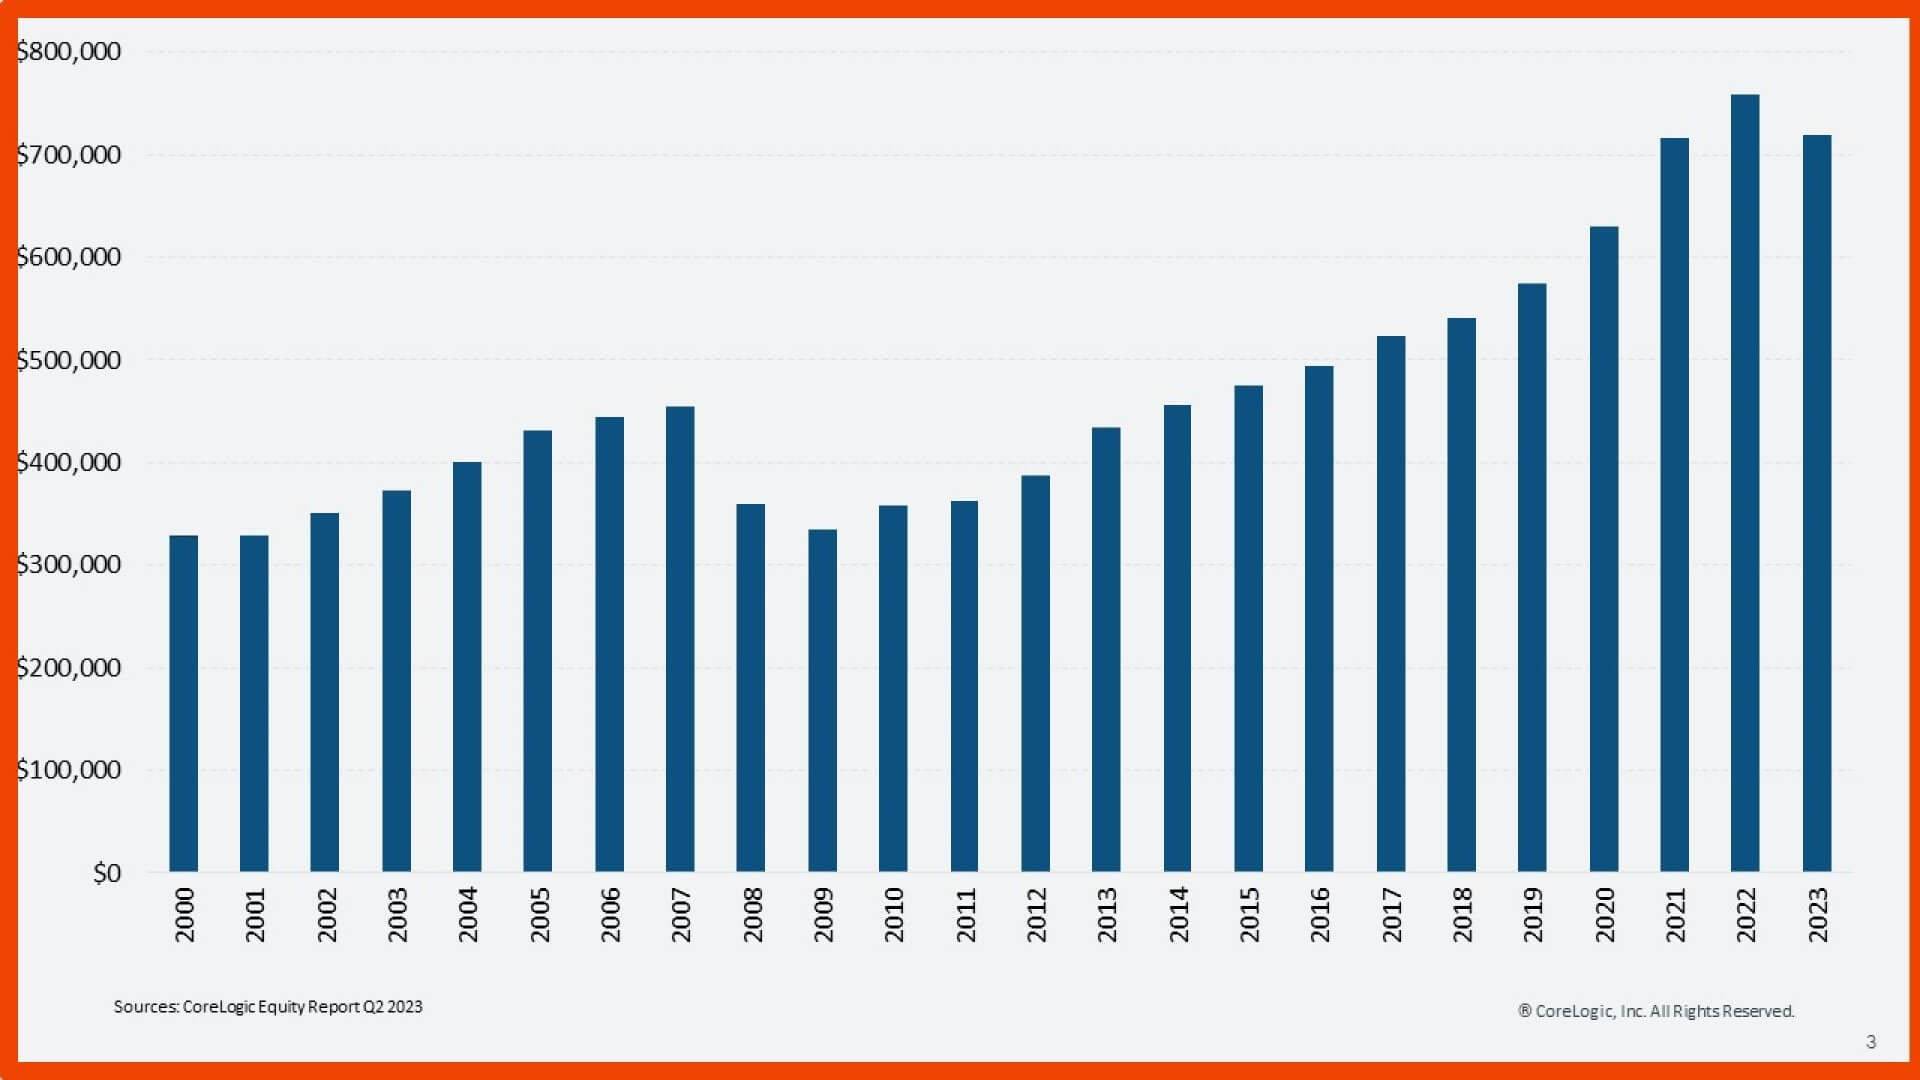
Focusing on a geographic area makes this point even clearer. Figure 3 replicates the methodology used in Figure 2 for Los Angeles County, California.
That county saw some of the most extreme changes during the housing crisis, experiencing a 170% rise from 2000 through 2006 and a 40% decline between 2007 and 2010. The difference between the bars for 2007 and 2006 is clear. Average buyers from 2007 in Los Angeles County still have $450,000 remaining on their mortgages, while buyers from 2010 have an average of $355,000 remaining on their mortgages.

While timing the real estate market is crucial to building wealth, housing investments have inherent risks. Real estate markets, like all financial markets, are influenced by numerous factors and are therefore very difficult to accurately predict. For instance, very few forecasts projected home prices increasing by 40% or more when the pandemic began in early 2020.
CoreLogic’s quarterly Home Equity Report tracks the latest market trends on national, state and metro-area levels. And for more data-driven real estate analyses and insights from our team of experts, visit CoreLogic’s Office of the Chief Economist’s home page.


