Affordability and warmer metros continue to attract homebuyers
For homebuyers, affordability, job opportunities and outdoor amenities are major driving factors for relocation. Our previous analysis showed that homebuyers who relocated to another metro in recent years often chose metros adjacent to their current location and/or had a lower cost of living.
Although homebuyers were weighing these considerations before COVID-19, the migration rate to cities featuring these factors grew during the pandemic. With the combination of low for-sale inventory, low interest rates and a shift to a more flexible working environment, more people moved out of expensive metros in search of affordability, outdoor amenities and warmer weather.
However, homebuyers’ location choice may shift again. As more employees returned to offices, homes sold for higher prices, interest rates climbed and uncertain economic conditions prevailed, these external economic forces may have influenced homebuyers’ decisions in 2022. The following analysis uses CoreLogic loan application data from 2019 to 2022 to highlight trends in owner-occupant homebuyer mobility and migration in 2022[1], focusing on metros with the greatest in- and out-migration of potential homebuyers[2].
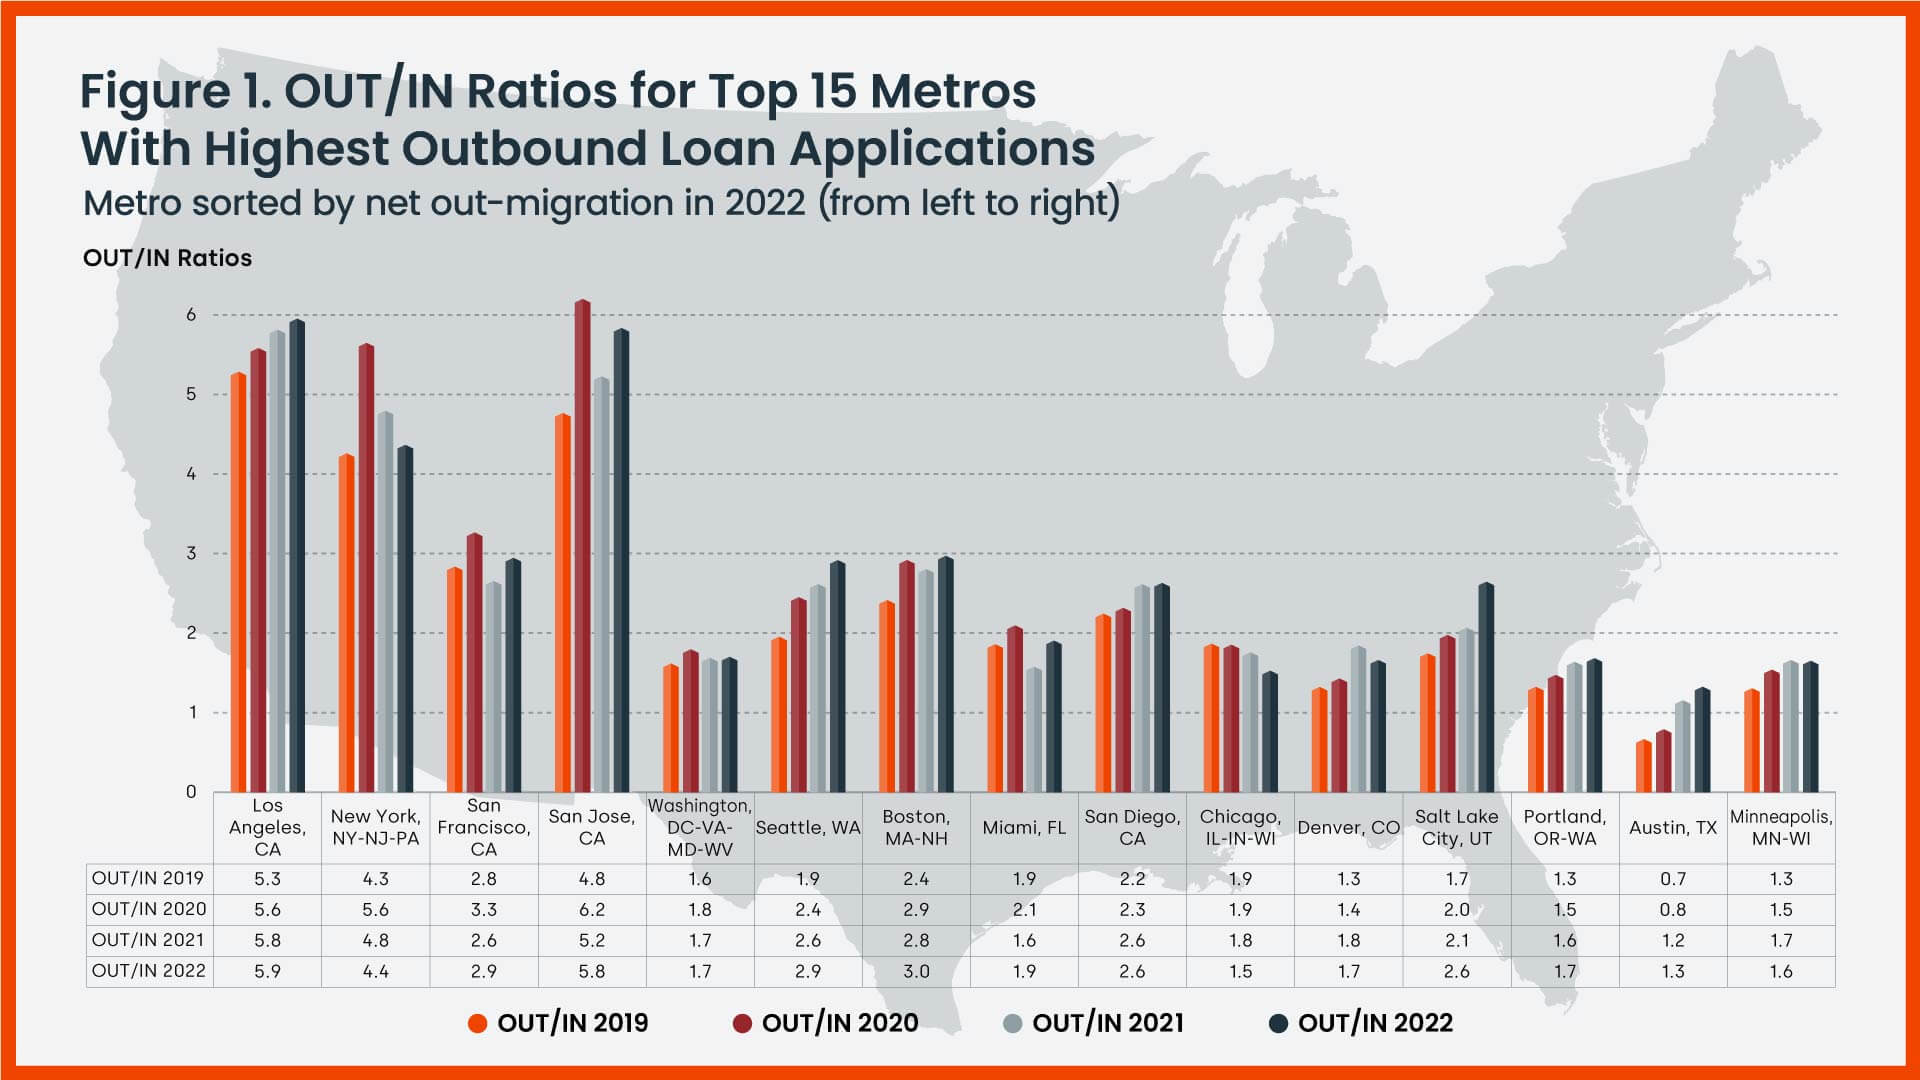
Figure 1 shows the OUT/IN ratio for the top 15 metros with the highest levels of out-migration loan applications[3]. The OUT/IN ratio for most of these metros remained relatively consistent over the four-year period.
However, Austin made the list in 2022. In 2019 and 2020, more people moved into Austin than moved out, but that trend flipped in 2021 and 2022 as Austin became less affordable for many potential homebuyers. Los Angeles ranks as the top market for the highest net out-migration among all the metros in 2022. New York had the second highest out-migration followed by San Francisco and San Jose, California. These four metro areas have ranked as top out-migration markets since at least 2019[4].

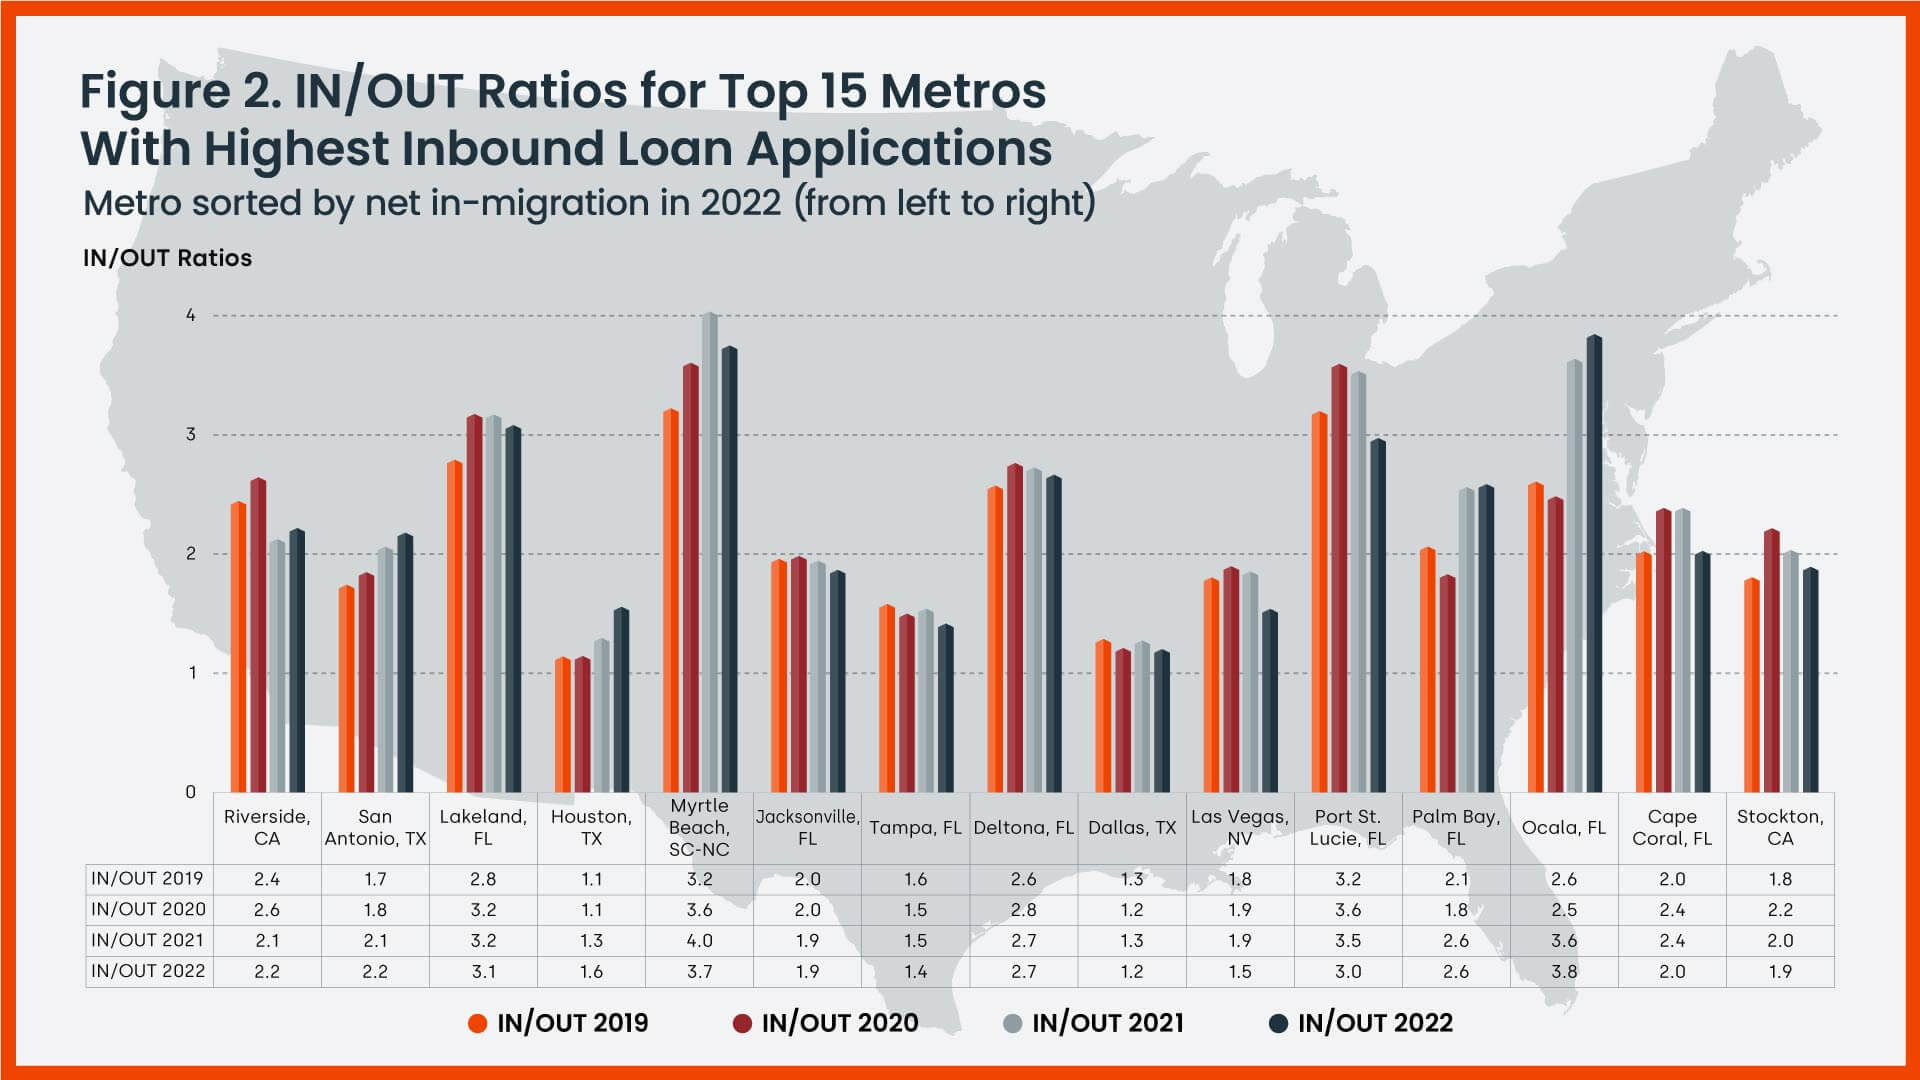
In contrast, Figure 2 shows the IN/OUT ratio for the top 15 metros with the highest in-migration loan application activity. Almost without exception, in-migration metros are more affordable compared to the ones presented in Figure 1. Although California cities like Riverside and Stockton may not be affordable from a national perspective, relative to adjacent coastal California metros, they are more affordable.
The metros in Figure 2 are sorted left to right by net in-migration in 2022, meaning that more people moved into these metros than moved out. Riverside, California, had the highest in-migration activity followed by Lakeland, Florida; San Antonio, Texas; and Houston, Texas. In general, metros in Florida tend to have relatively more incoming applications than outgoing ones.

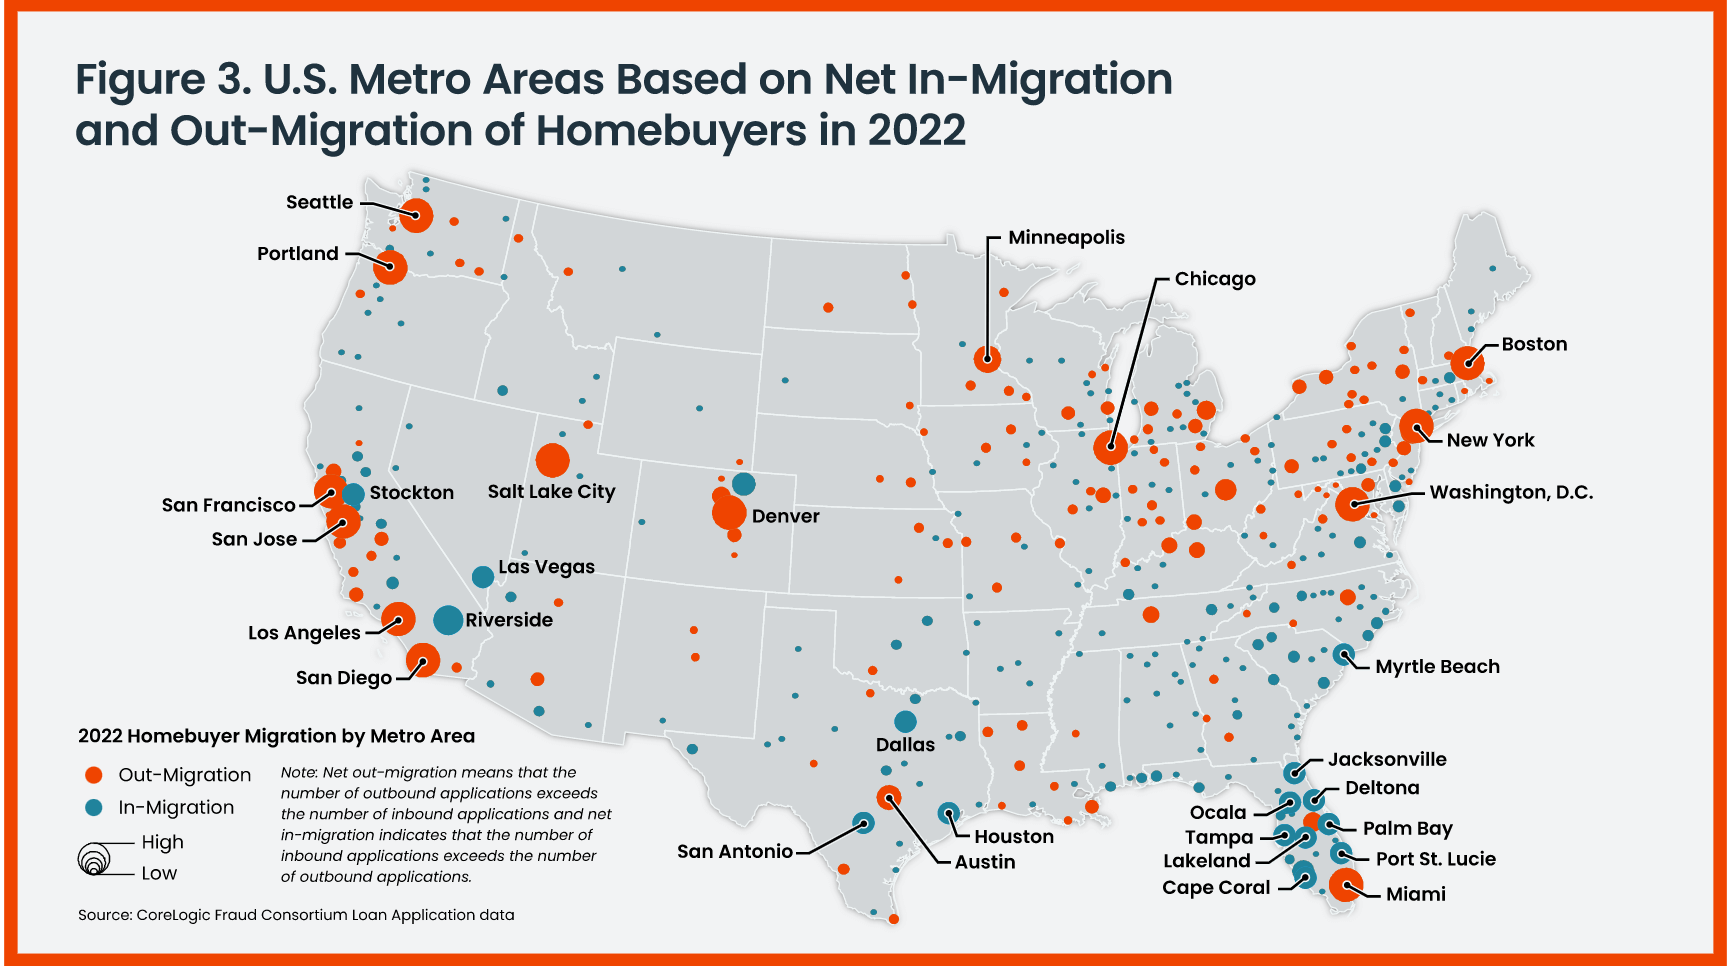
Figure 3 shows a map labeling the top 15 U.S. metros with the largest net in- and out-migration.

In 2022, homebuyers continued to seek affordable metros both adjacent to their current place of residence as well as out of state. This is a trend that we observed in prior years and that has persisted since the pandemic.
Thanks to the flexibility of remote work, more people moved into affordable states such as Florida, Texas and South Carolina compared to pre-pandemic. However, the ratios of in-migration to out-migration for all these states were higher in 2022 compared to pre-pandemic levels.
Since remote work reduced the need to live near an employer, families have been able to broaden their homebuying search and consider affordability and other external amenities, a trend that accelerated homebuyers’ migration rate. As affordability continues to be an important consideration for homebuyers, we are likely to see more applicants buying in less expensive markets going forward.
[1] January through December
[2] The analysis is based on all home purchase mortgage applications, accepted or not, from January 2022 through December 2022 and compared to applications in 2021 – 2020 (pandemic period) and 2019 (pre-pandemic). Investors and second-home buyers were excluded from the analysis. The metros are at the Core-Based Statistical Areas (CBSA)-level.
[3] OUT/IN ratio is the number of applications by residents buying outside the metro in which they currently live relative to the number of out-of-metro applications to buy into that same metro.
For example, a ratio of six for Los Angeles means that there were six Los Angeles households buying outside of Los Angeles for every one out-of-Los Angeles resident buying into Los Angeles.
[4] Since the metros are sorted by counting the highest number of outbound loan applications, larger metros tend to have a lot of applications and rank on the top.


