The year 2020 was particularly active when it comes to natural hazard and catastrophic risks posed to property. We witnessed a 7.0 magnitude earthquake in Turkey and Greece, record-breaking wildfires in California, and the most active hurricane season on record. While much of the news focused on the impact of these natural catastrophes on residential or commercial structures, these events can also have a significant impact on the energy, utility, and communication sectors. Knowing the potential severity and extent of damage beforehand while also understanding the real damage after the fact are both critical pieces to ensuring continued service to your distributed client base.
Catastrophic events such as Hurricane Laura, the Grizzly Creek Fire in Colorado or the Silverado Fire in California should serve as a wake-up call for energy, utility, and communication sectors on the devastating impact of natural disaster events.
Understanding the natural hazard risk, however, requires more than just a meteorology degree. It requires highly accurate location information. The more granular you can get, the better.

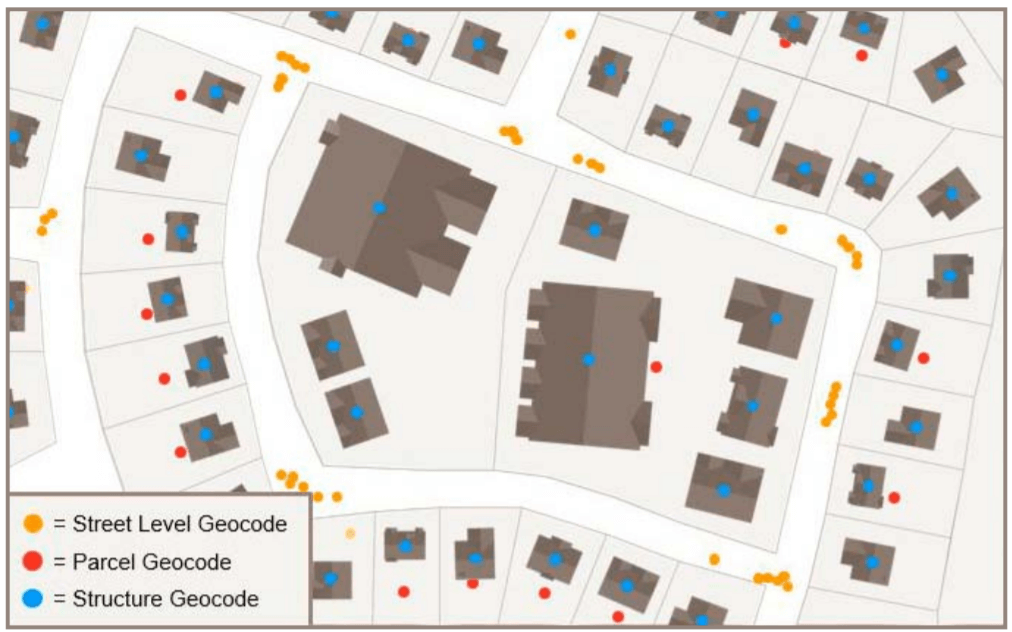
Hazard analysis and risk assessment is only possible because of precise location intelligence via true rooftop geocoding. Even a few meters this way or that way, or a minor difference in elevation on one side of the building from the other, can make a huge difference in the risk from high-loss, high-gradient perils like flooding. In addition, knowing the structures beyond just primary/secondary structures, barns, sheds and more can help to paint a more accurate picture of the exposure.
With the location foundation in place, natural hazard assessment becomes more precise.
Having a sound view into what could happen gives these sectors the opportunity to optimize their response plans while mitigating risk to assets and reducing customer service interruption.
For instance, the number one metropolitan area at elevated wildfire risk in the United States is Los Angeles, California, with 154,462 single-family residences (SFRs) at risk. Altogether, the reconstruction cost value—or the cost to completely rebuild the property assuming 100% destruction—is $90.31 billion (Table 1).
| Rank | Metro Area | State | Number of SFR at Elevated Risk | RCV of SFR at Elevated Risk(in billion) |
|---|---|---|---|---|
| 1 | Los Angeles | CA | 154,462 | $90.31 |
| 2 | Riverside | CA | 126,628 | $50.62 |
| 3 | San Diego | CA | 98,970 | $47.45 |
| 4 | Sacramento | CA | 73,863 | $30.55 |
| 5 | Austin | TX | 73,756 | $22.67 |
| 6 | San Francisco | CA | 37,600 | $18.67 |
| 7 | Denver | CO | 55,762 | $17.73 |
| 8 | Thousand Oaks | CA | 27,331 | $13.80 |
| 9 | Truckee | CA | 35,523 | $12.27 |
| 10 | San Antonio | TX | 41,299 | $11.66 |
This kind of assessment is a useful tool to understand how great the risk is—and where it is.
By using the best loss simulations, the energy, utility, and communication sectors can ensure a comprehensive look at the best- and worst-case scenarios of impact if a catastrophic event were to happen.
And with weather verification services – including a full, granular view of perils impacting assets, with down to the minute, mile-per-hour, and tenth of an inch metrics – these critical sectors can ensure they have an accurate view of what actually happened, enabling faster response time.
Understanding where assets are located and their potential risks offers the ability to proactively mitigate and put in place a solid business continuity plan. Having a consistent source of forecasting, with impact scores as an event approaches, can give these critical sectors the time needed to enact a fallback plan, limiting the impact to assets and customer service.
Learn More :
Solutions for Telecommunications
© 2021 CoreLogic, Inc., All rights reserved.
CORELOGIC and the CoreLogic logo are trademarks of CoreLogic, Inc. and/or its subsidiaries. All other trademarks are the property of their respective holders.


