Economists investigate the correlation between prices and investor activity
The U.S. housing market has seen significant growth in both home prices and demand over the past few years, driven by factors such as low interest rates, a growing economy and an inventory shortage. Cumulatively, these factors pushed national home prices up 41% between January 2020 and July 2022. During this period, investor activity in the housing market hit an all-time high. In 2021, investor made 23% of all single-family home purchases, and by 2022, that figure was 25%.
The question now is: Were investors motivated to invest because of the increases in rent and prices, or did their investment create these increases? Figures 1 through 4 show that the answer is likely a bit of both, but perhaps more influence is due to investors following these rent increases.
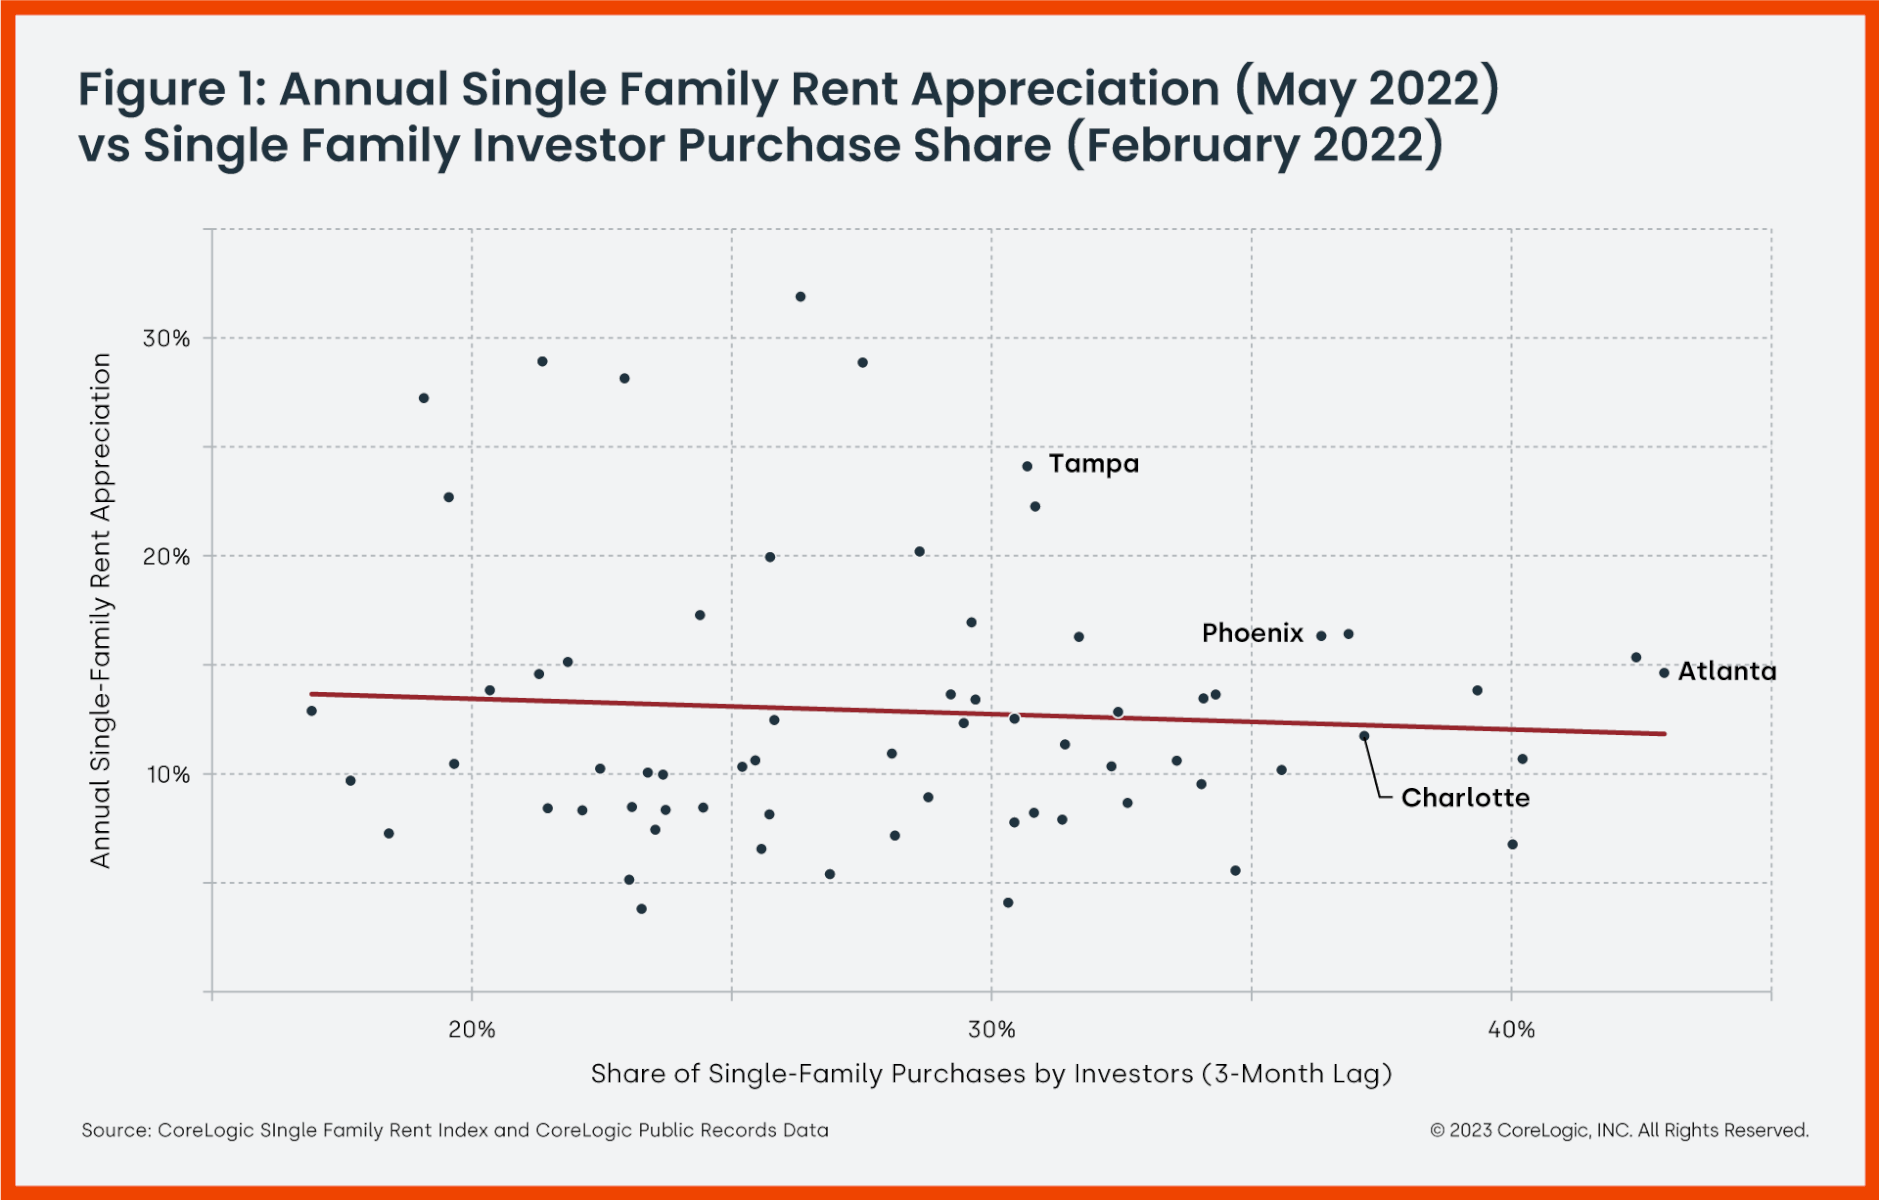
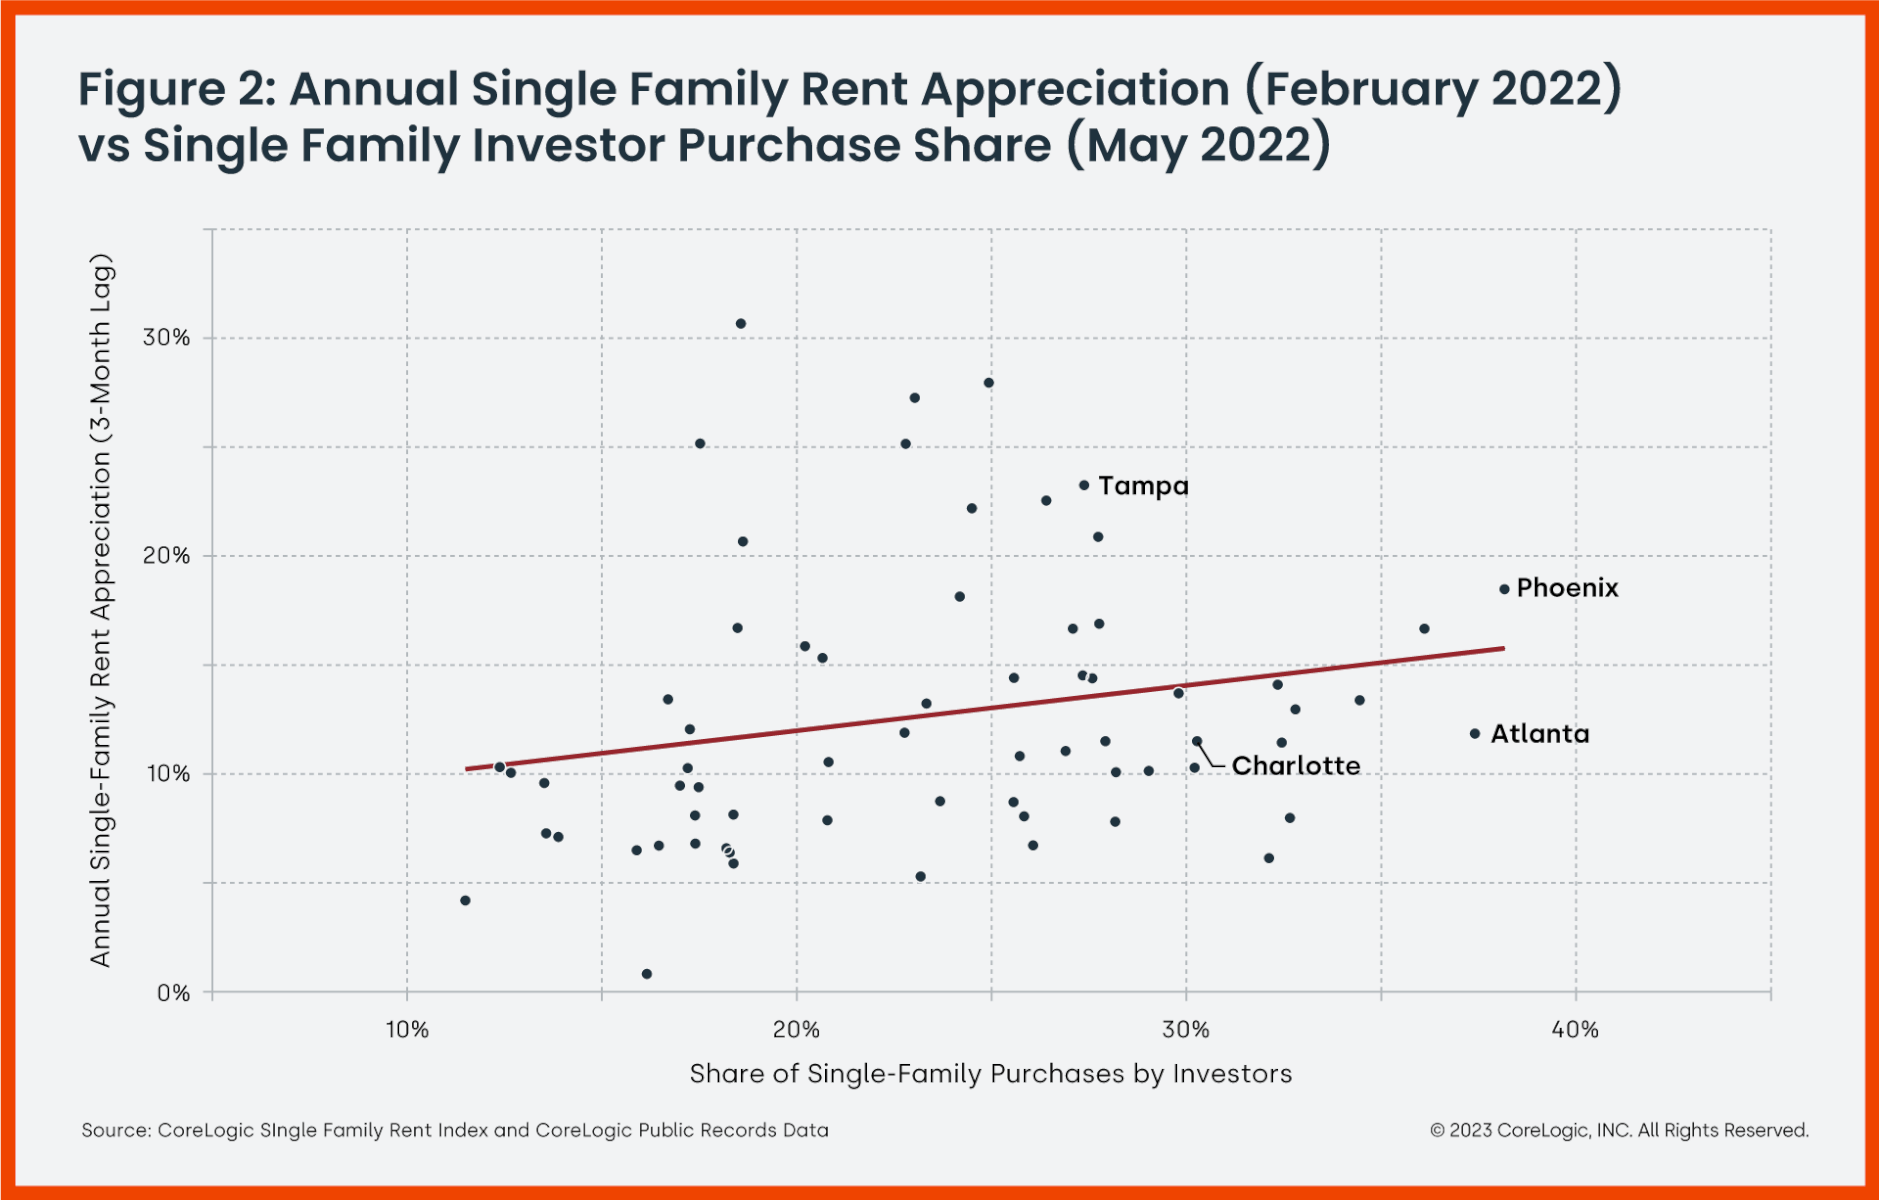
Figure 1 charts the year-over-year increase in single-family rent in May 2022 against the share of purchases made by investors three months prior in February. Figure 2 inverts the relationship, comparing February 2022 rent increase data with May 2022 investor share data.
Figure 1 reveals little relationship between investor activity and rent increases in the subsequent months. However, Figure 2 shows that after rents increased in a metro area, investors bought in that area in the following months. This would suggest that investors were chasing rising rents rather than driving them during the heated housing market in the first half of 2022.
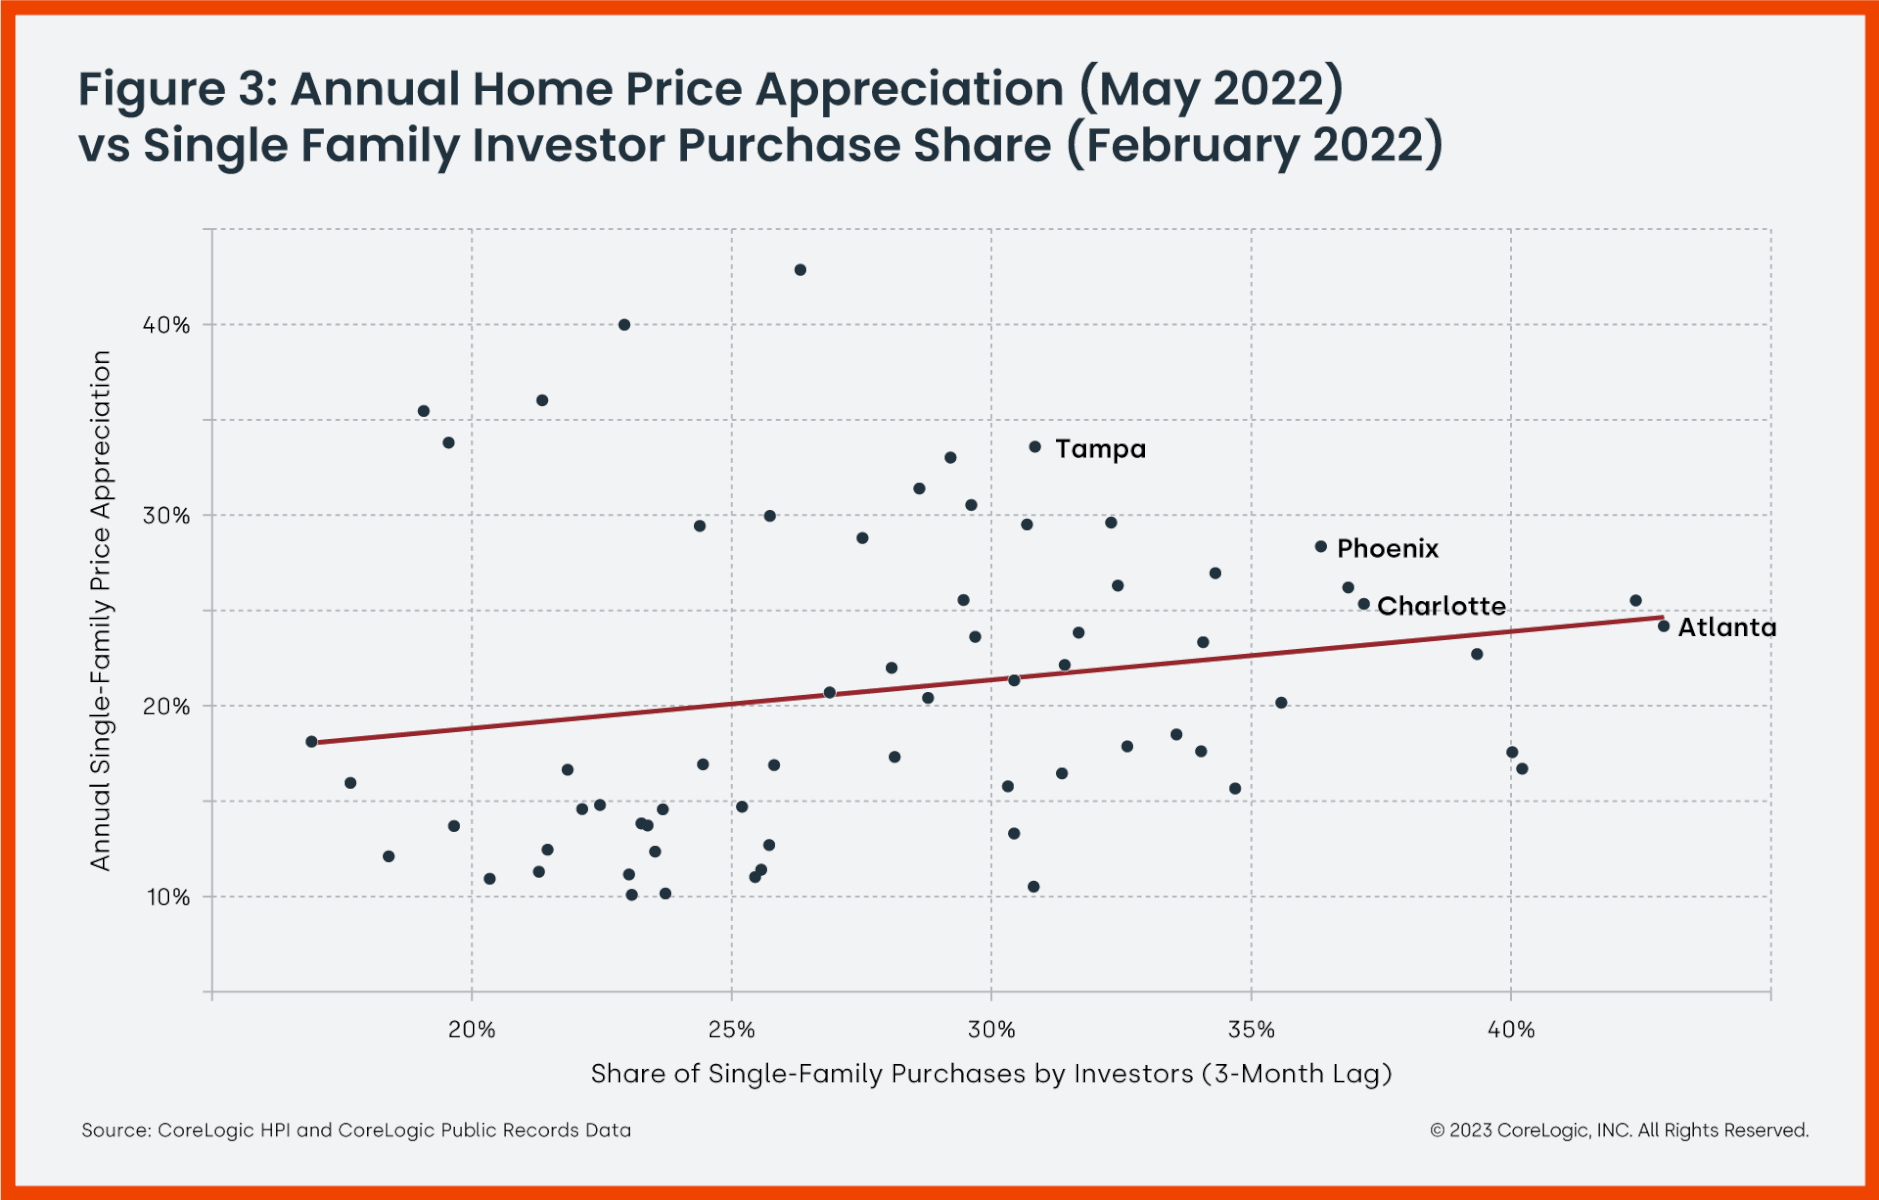
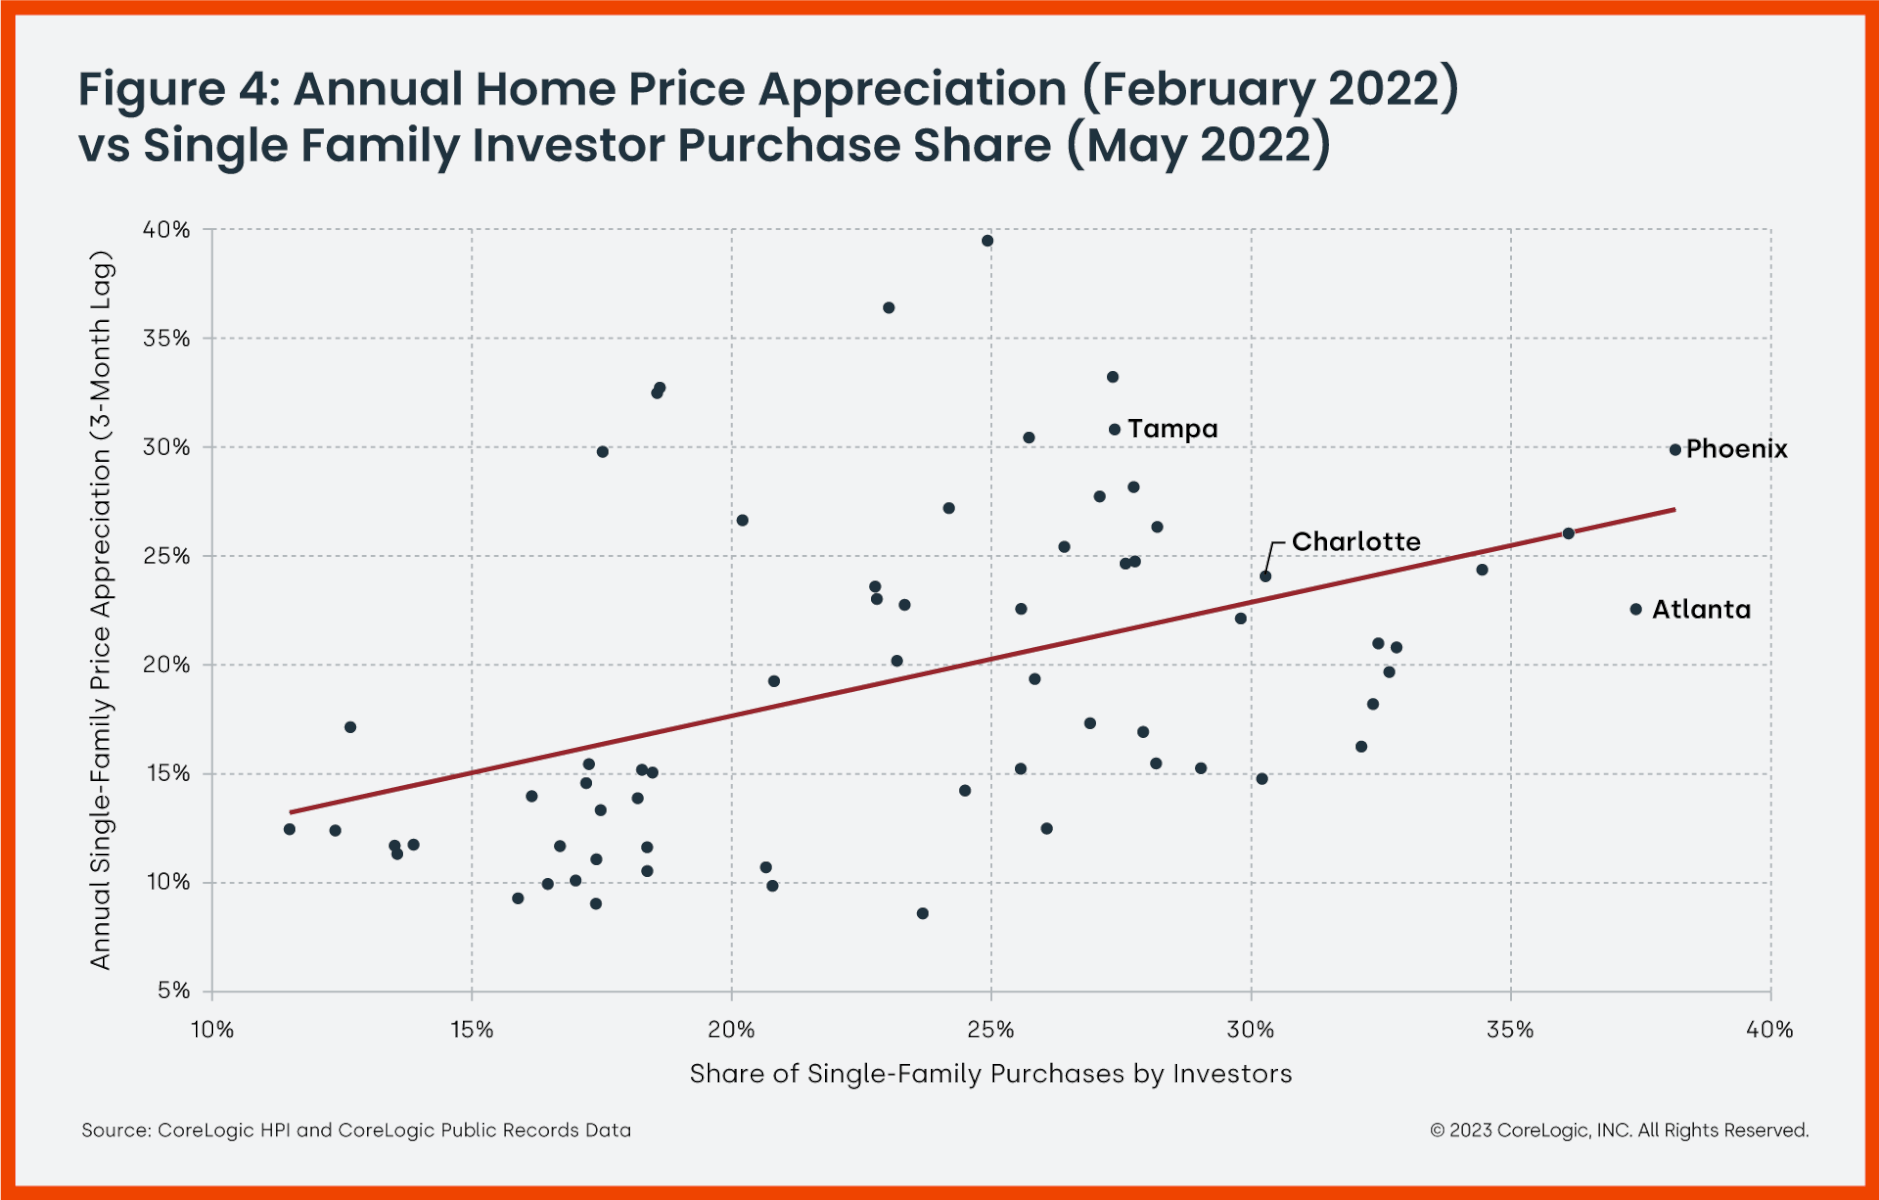
Figures 3 and 4 explore the same relationships as Figures 1 and 2 but replace rent appreciation with home price appreciation. The resulting correlation suggests that prices and investor activity were more tightly connected than rents and investor activity.
Figure 3 demonstrates that locations where investors bought experienced home price increases. This is natural since investors bring more demand to the market but do not add supply. This contrasts with a reseller who is likely selling one home to buy another, meaning they are adding to the supply and demand pools evenly.
However, Figure 4 shows that the connection between where prices were rising three months ago and investor activity trends is even tighter.
Of course, the market has since changed. Home prices have declined 5.1% from their peak in July 2022, and although rents are still growing, they are doing so at a slower pace. The locations that investors flocked to during the housing market boom are the same markets that are currently leading the price slowdown.
Nevertheless, investors seem undeterred and are still buying in the same locations at a rate well above pre-pandemic levels.
What this means is hard to say, but there are three major possibilities:
- Inertia resulting from previous buying patterns may make investors stick to familiar markets rather than move on to places that they are less familiar with.
- Investors may simply be anticipating that price and rent decreases will soon spread to other locations.
- Or investors could still see these locations as better investments in the long term.
Many of the locations that boomed during the pandemic, particularly those in the South and Mountain West — such as Phoenix, Arizona; Atlanta, Georgia; and Salt Lake City, Utah — have had strong population growth since well before the pandemic, and even if prices decline short-term, these metros are likely to continue growing in the long term.
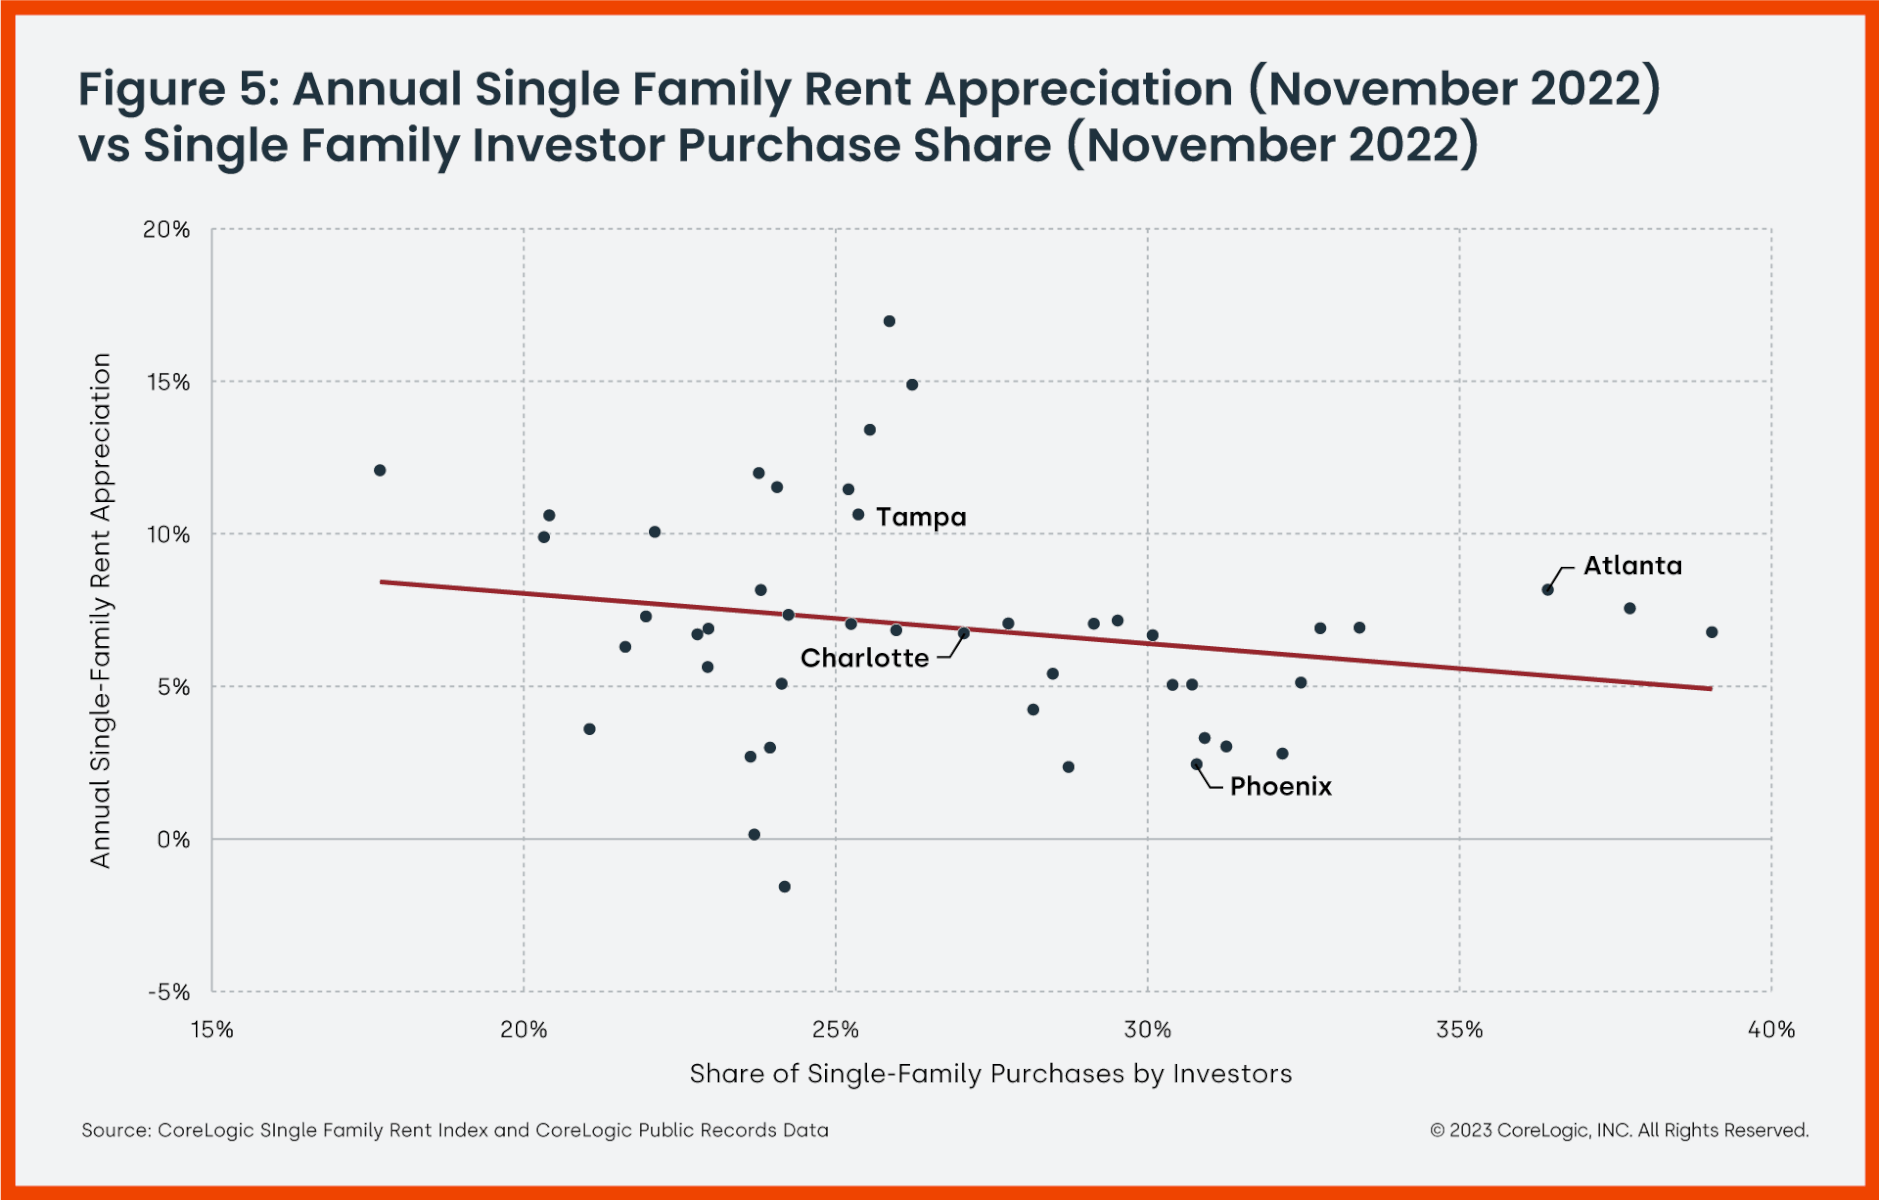
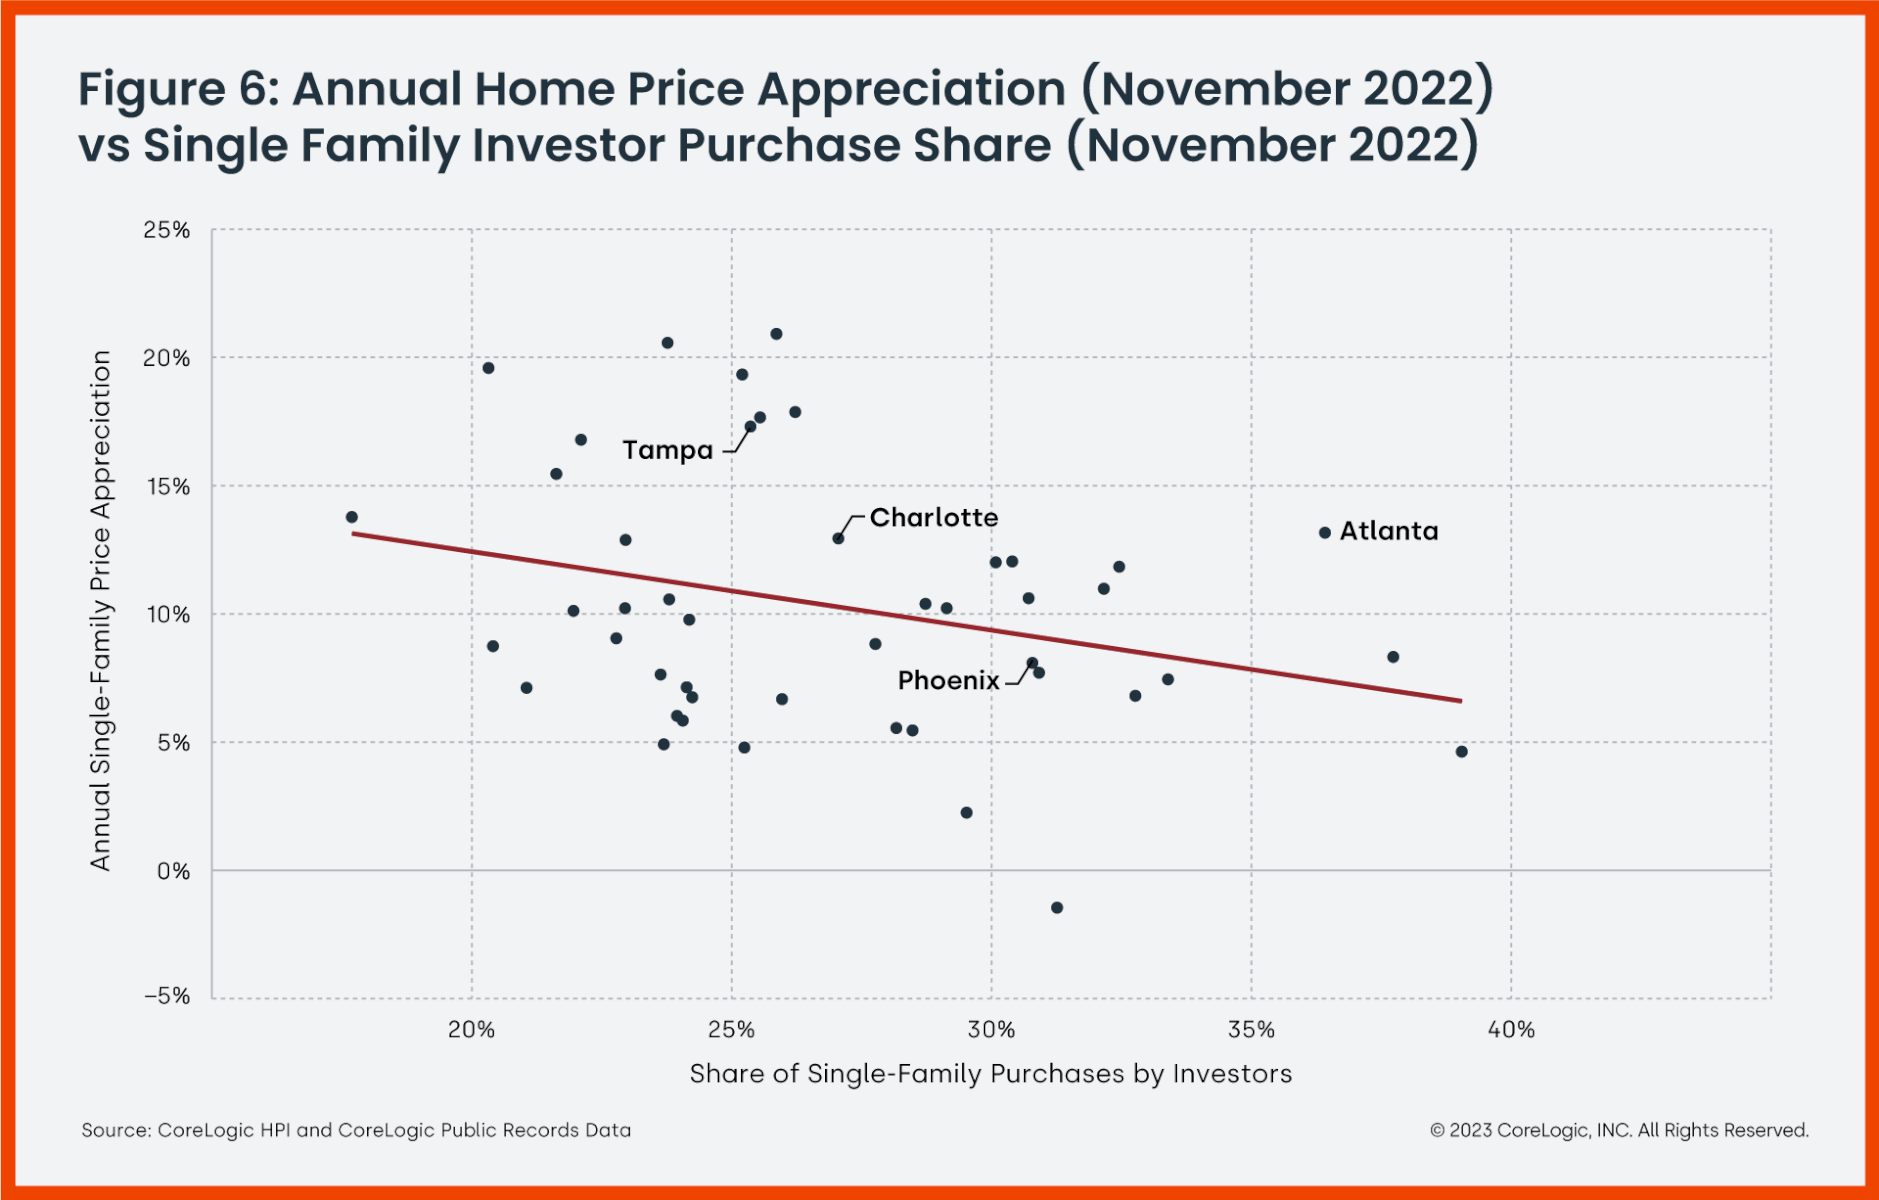
Overall, investors seem to have jumped into the market when demand was elevated and are sticking around now that both prices and demand are cooling off.
The real estate market has been a rollercoaster since March 2020 and timing it has been tricky. In most areas, home prices have fallen from the peak in 2022. As a result, investors will lose some equity, but with rent growth remaining relatively stronger than pre-pandemic, and home prices still far above pre-pandemic levels, few are likely to regret their purchases.

