


Introduction
The CoreLogic Loan Performance Insights report features an interactive view of our mortgage performance analysis through September 2023.
Measuring early-stage delinquency rates is important for analyzing the health of the mortgage market. To more comprehensively monitor mortgage performance, CoreLogic examines all stages of delinquency as well as transition rates that indicate the percent of mortgages moving from one stage of delinquency to the next.
The report is published monthly with coverage at the national, state and Core Based Statistical Area (CBSA)/Metro level and includes transition rates between states of delinquency and separate breakouts for 120+ day delinquency.
“The overall U.S. delinquency rate was unchanged from one year ago in September and remains near an all-time low. While there was a decrease in the share of mortgages six months or more past due, there was a compensating increase in early-stage delinquencies. If the labor market weakens in the coming months, expect further increases in mortgage delinquencies.”
– Molly Boesel
Principal Economist for CoreLogic
30 Days or More Delinquent – National
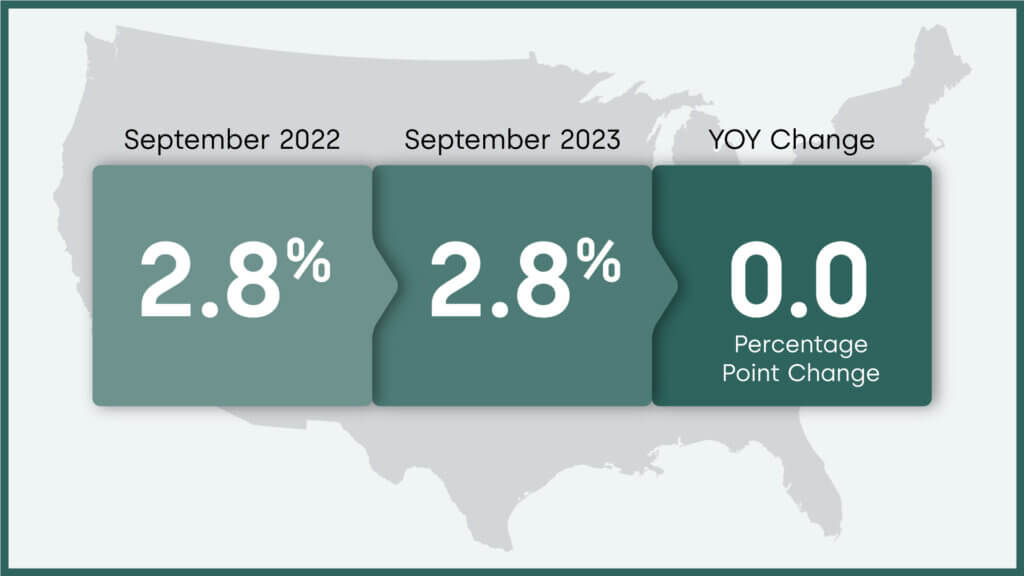
In September 2023, 2.8% of mortgages were delinquent by at least 30 days or more including those in foreclosure. This represents a 0.0 percentage point change in the overall delinquency rate compared with September 2022.
Mortgage Performance Remains Solid, Though Natural Disasters Have an Impact
An overwhelming majority of homeowners with a mortgage were able to make their payments on time in September, in line with data recorded since the spring of 2022. Fifteen states saw annual upticks in overall delinquency rates, with increases ranging from 0.5% to 0.1% in each of those states. Mortgage performance remains on solid ground in part thanks to a still-healthy job market, although it is worth noting that the U.S. unemployment rate inched up to its highest level since January 2022 in October.
September delinquency rates are also reminders of the impact that natural disasters have on mortgage performance. One month following the hurricane-fueled wildfires in Hawaii, delinquency rates increased in the Kahului-Wailuku-Lahaina metro. Similarly, delinquency rates are still elevated in Punta Gorda, Florida and Cape Coral-Fort Myers, Florida a full year after Hurricane Ian hit those areas.
Loan Performance – National
CoreLogic examines all stages of delinquency to more comprehensively monitor mortgage performance.
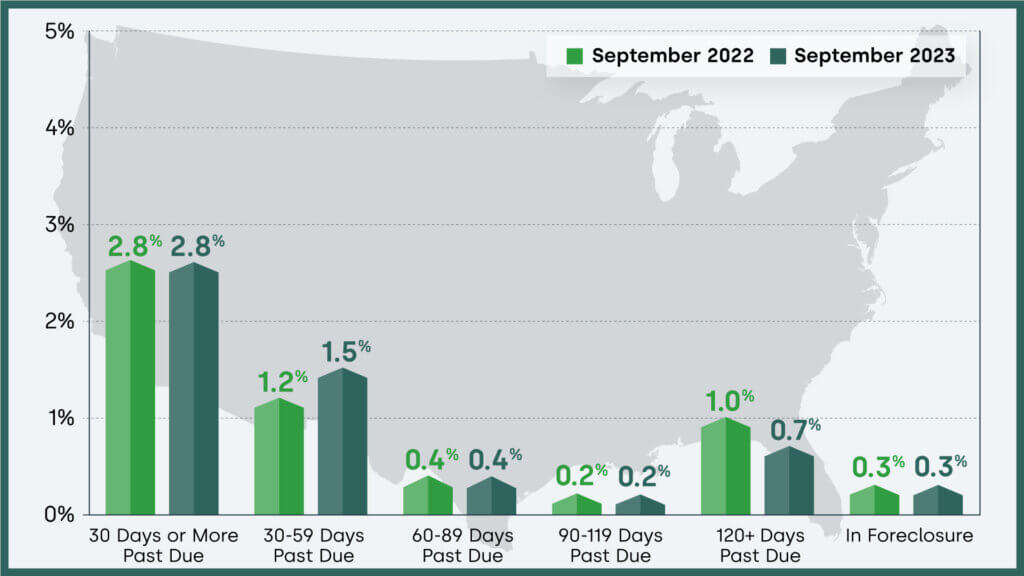
The nation’s overall delinquency rate for September was 2.8%. The rate for early-stage delinquencies – defined as 30 to 59 days past due – was 1.5% in September 2023, up from September 2022. The share of mortgages 60 to 89 days past due was 0.4%, unchanged from September 2022. The serious delinquency rate – defined as 90 days or more past due, including loans in foreclosure – was 0.9% down from 1.2% in September 2022.
As of September 2023, the foreclosure inventory rate was 0.3%, unchanged from September 2022.
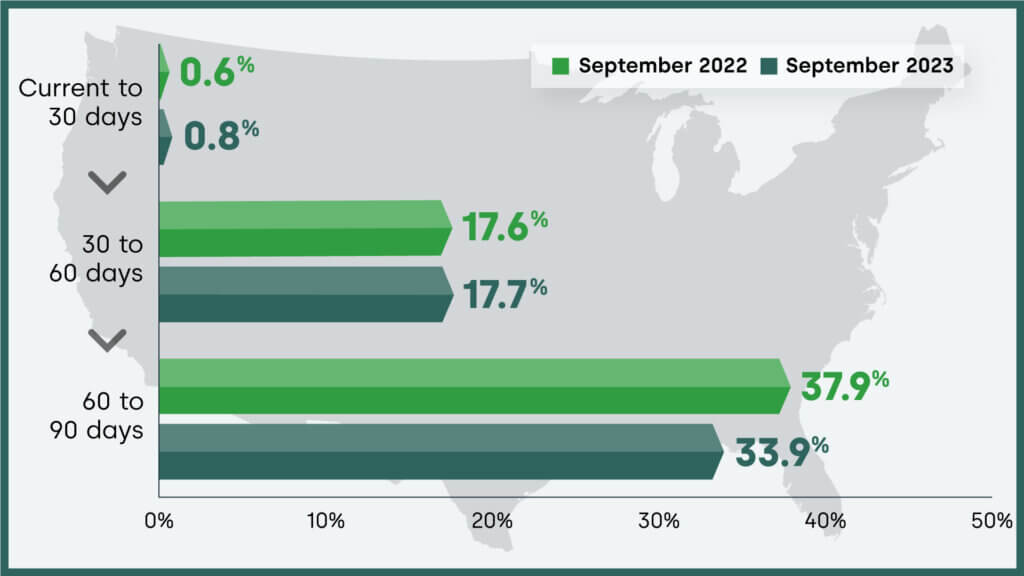
Transition Rates – National
CoreLogic examines all stages of delinquency as well as transition rates that indicate the percent of mortgages moving from one stage of delinquency to the next.
The share of mortgages that transitioned from current to 30-days past due was 0.8%, up from September 2022.
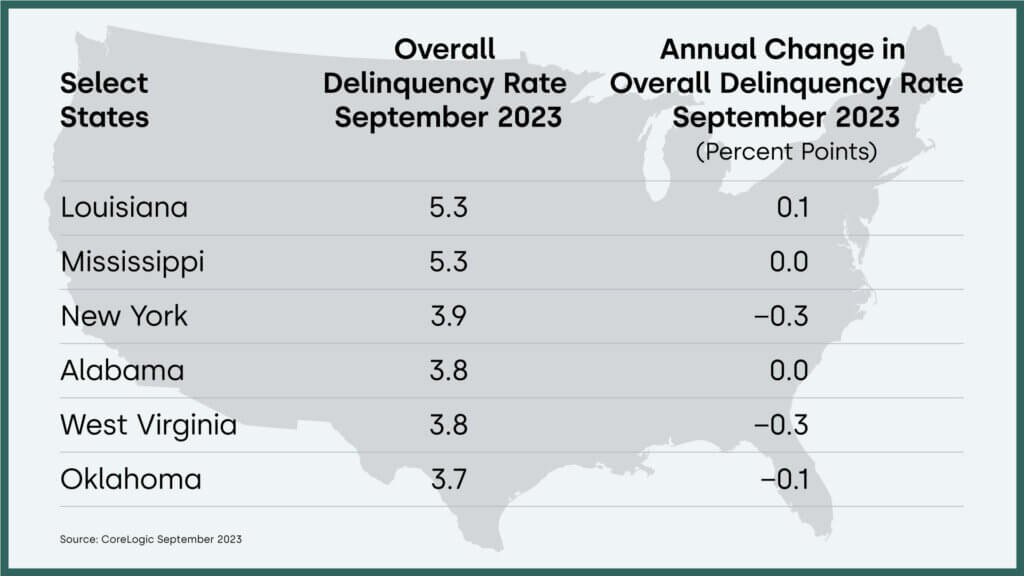
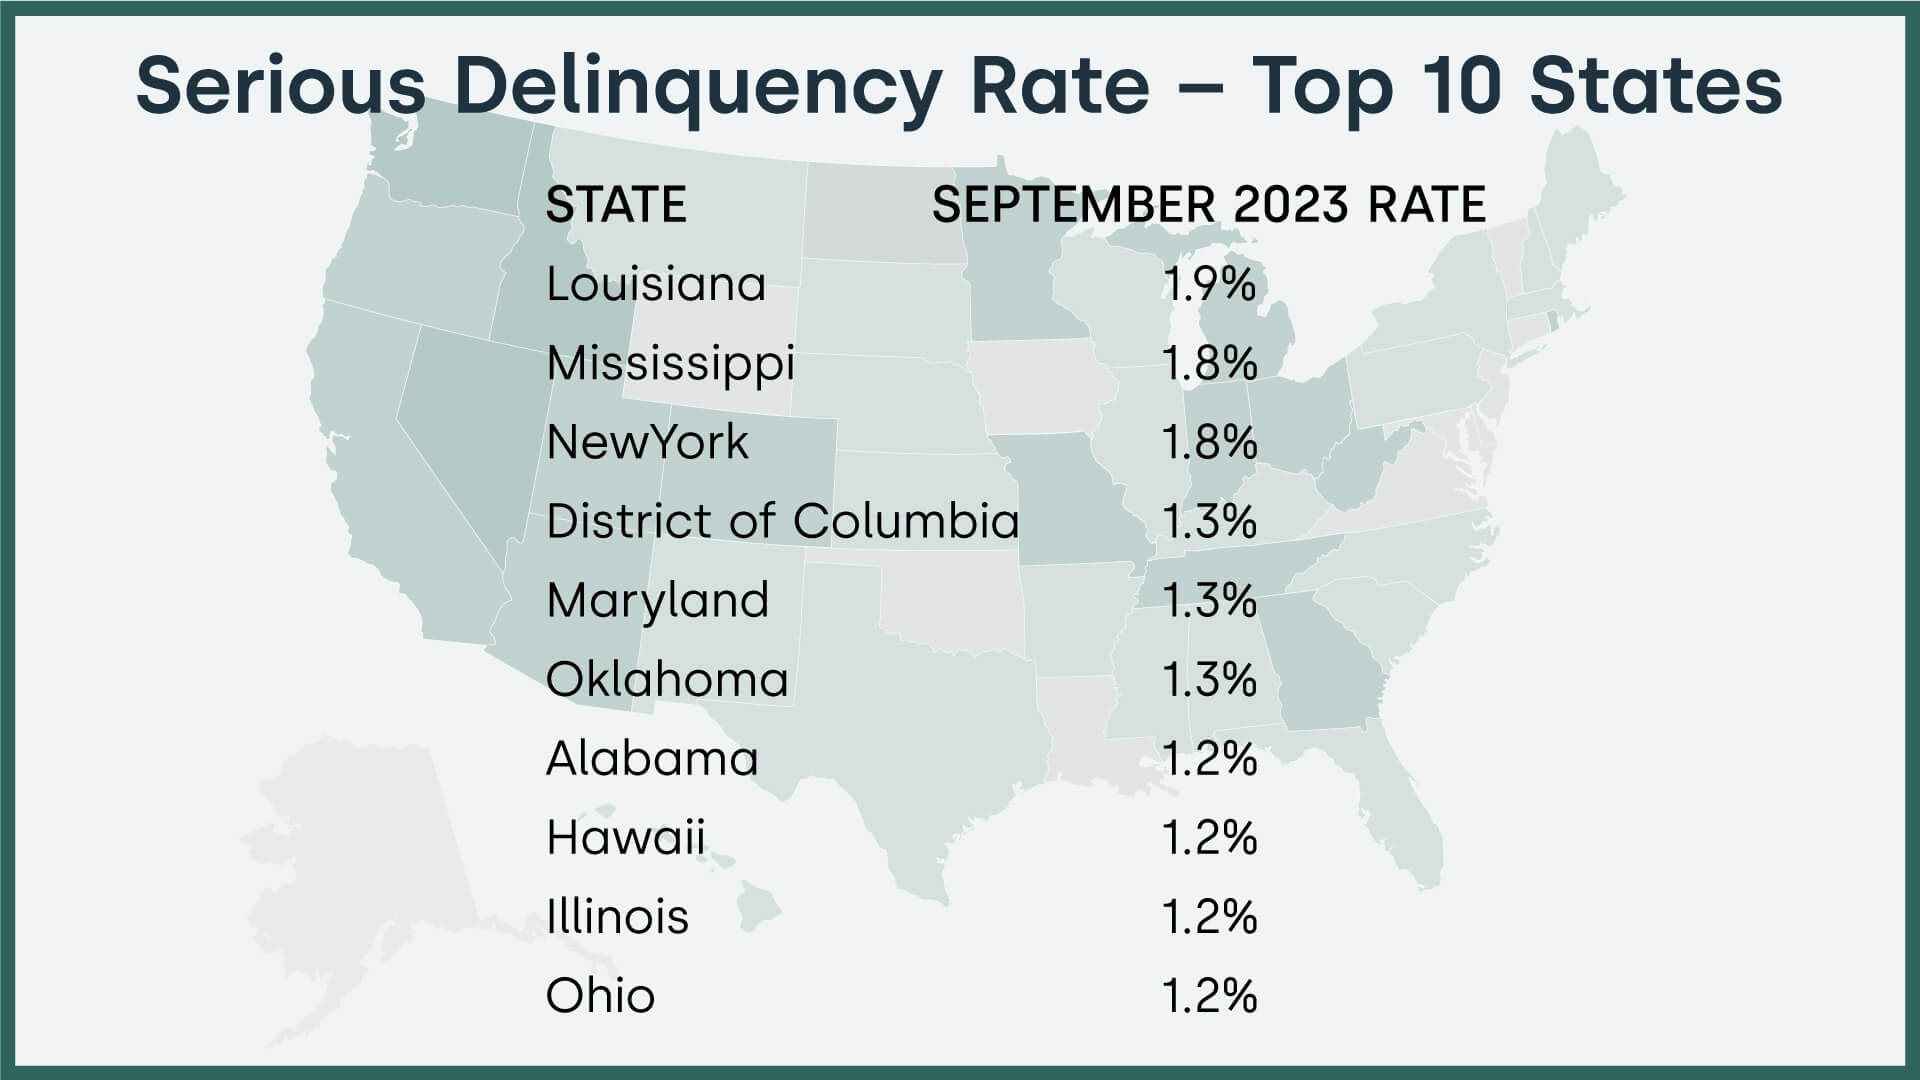
Overall Delinquency – State
In September 2023, 15 states posted small year-over-year increases in overall delinquency rates, while 17 states were unchanged. The states with the largest annual declines were New York and West Virginia.
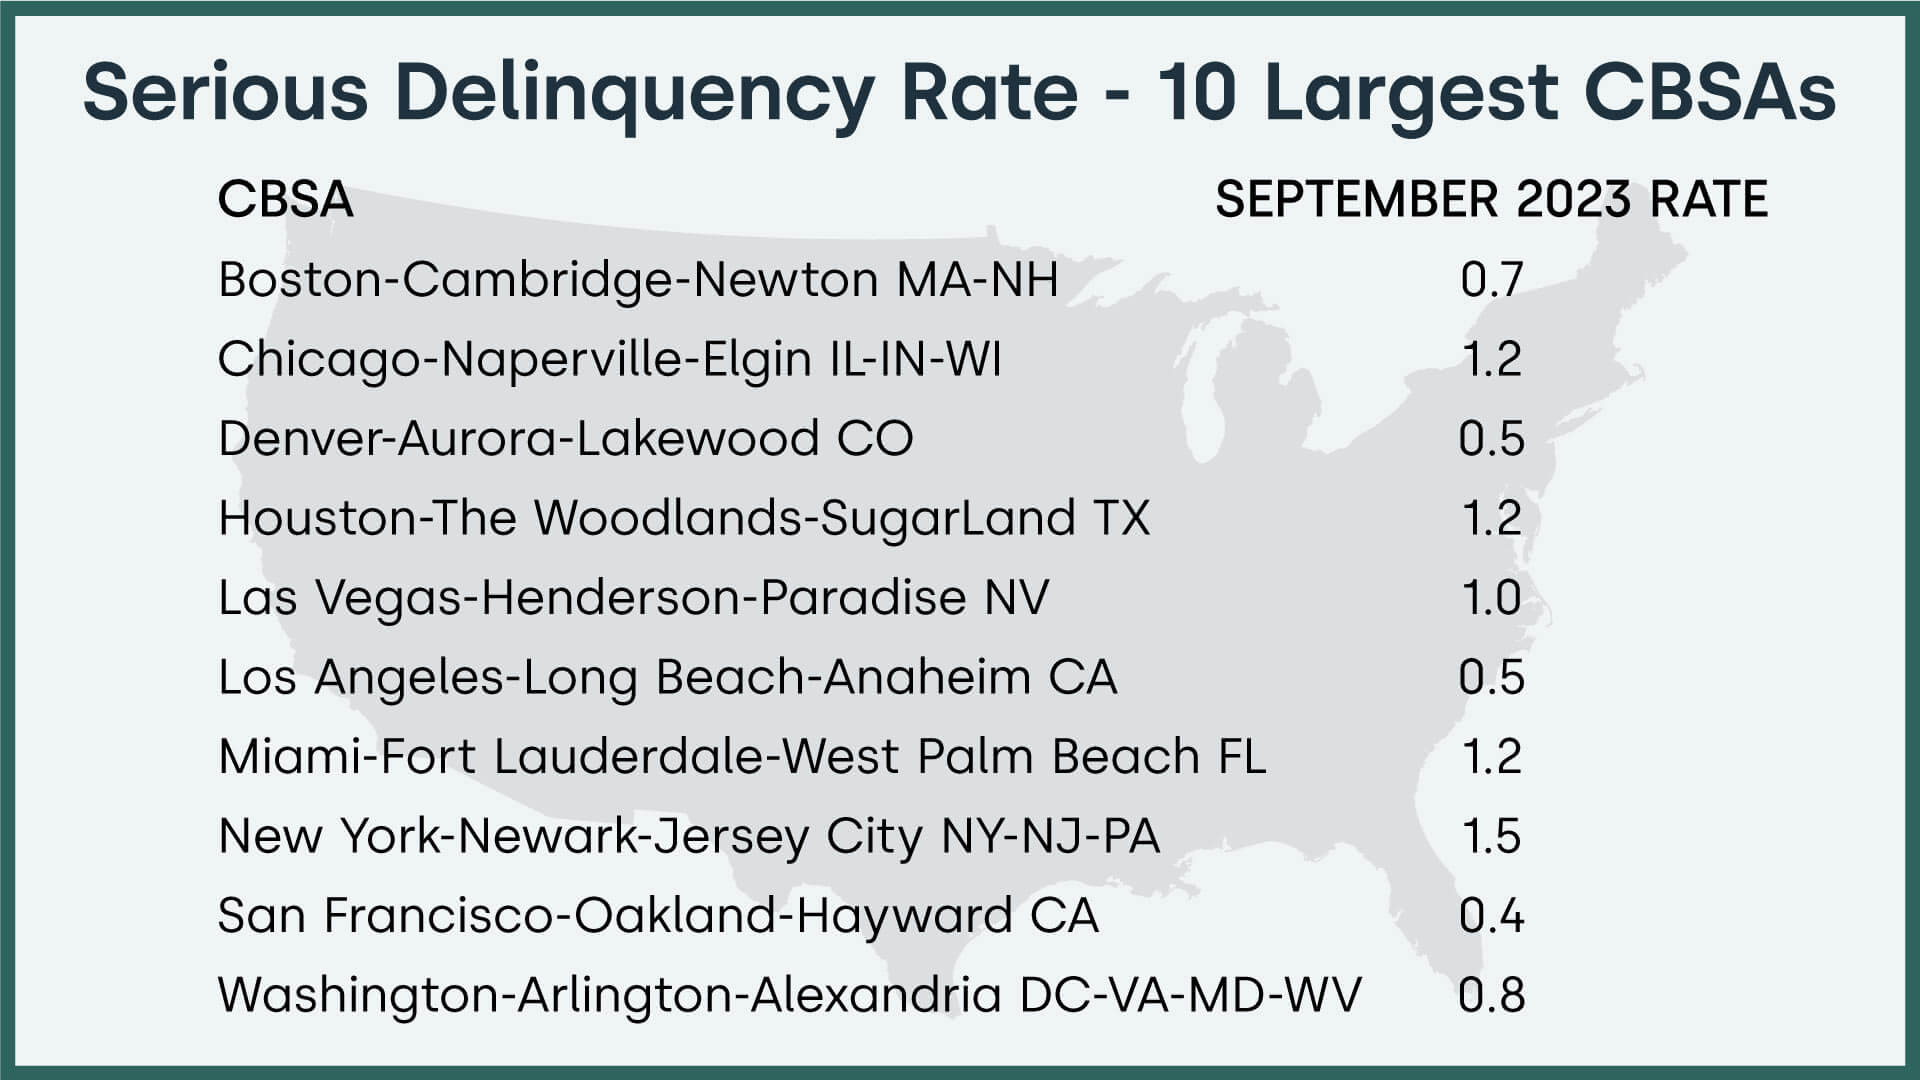
Serious Delinquency – Metropolitan Areas
Serious delinquency is defined as 90 days or more past due including loans in foreclosure.
There were three metropolitan areas where the serious delinquency rate increased.
There were 14 metropolitan areas where the serious delinquency rate stayed the same.
There were 367 metropolitan areas where the serious delinquency rate decreased.
Summary
Measuring early-stage delinquency rates is important for analyzing the health of the mortgage market. To more comprehensively monitor mortgage performance, CoreLogic examines all stages of delinquency as well as transition rates that indicate the percent of mortgages moving from one stage of delinquency to the next.
For ongoing housing trends and data, visit the CoreLogic Intelligence Blog: www.corelogic.com/insights.
Methodology
The data in this report represents foreclosure and delinquency activity reported through September 2023. The data in this report accounts for only first liens against a property and does not include secondary liens. The delinquency, transition and foreclosure rates are measured only against homes that have an outstanding mortgage. Homes without mortgage liens are not subject to foreclosure and are, therefore, excluded from the analysis. Approximately one-third of homes nationally are owned outright and do not have a mortgage. CoreLogic has approximately 75% coverage of U.S. foreclosure data.
Source: CoreLogic
The data provided are for use only by the primary recipient or the primary recipient’s publication or broadcast. This data may not be resold, republished or licensed to any other source, including publications and sources owned by the primary recipient’s parent company without prior written permission from CoreLogic. Any CoreLogic data used for publication or broadcast, in whole or in part, must be sourced as coming from CoreLogic, a data and analytics company. For use with broadcast or web content, the citation must directly accompany first reference of the data. If the data are illustrated with maps, charts, graphs or other visual elements, the CoreLogic logo must be included on screen or website. For questions, analysis or interpretation of the data, contact Robin Wachner at [email protected]. For sales inquiries, please visit https://www.corelogic.com/support/sales-contact/. Data provided may not be modified without the prior written permission of CoreLogic. Do not use the data in any unlawful manner. The data are compiled from public records, contributory databases and proprietary analytics, and its accuracy is dependent upon these sources.
About CoreLogic
CoreLogic is a leading provider of property insights and innovative solutions, working to transform the property industry by putting people first. Using its network, scale, connectivity and technology, CoreLogic delivers faster, smarter, more human-centered experiences that build better relationships, strengthen businesses and ultimately create a more resilient society. For more information, please visit www.corelogic.com.
CORELOGIC, the CoreLogic logo, CoreLogic LPI and CoreLogic LPI Forecast are trademarks of CoreLogic, Inc. and/or its subsidiaries. All other trademarks are the property of their respective owners.
Media Contact
Robin Wachner
CoreLogic
[email protected]

