CoreLogic® estimates over 4,100 homes within tornado footprint
On the evening of Friday, March 24, a devastating EF-4 tornado tore through the towns of Rolling Fork, Mississippi, and Amory, Mississippi, causing widespread destruction. The tornado resulted in the tragic loss of at least 26 lives and many more individuals and properties were injured.
CoreLogic Reactor™ Identifies Over 4,100 Homes Worth an Estimated $881M Potentially Within Tornado Path
CoreLogic estimates that approximately 4,100 single- and multifamily residential properties with a combined reconstruction value (RCV) of $881 million were potentially within the tornado’s path. Table 1 provides the number and total reconstruction value of residential properties in Monroe County and Sharkey County by the probability of tornadic damage.
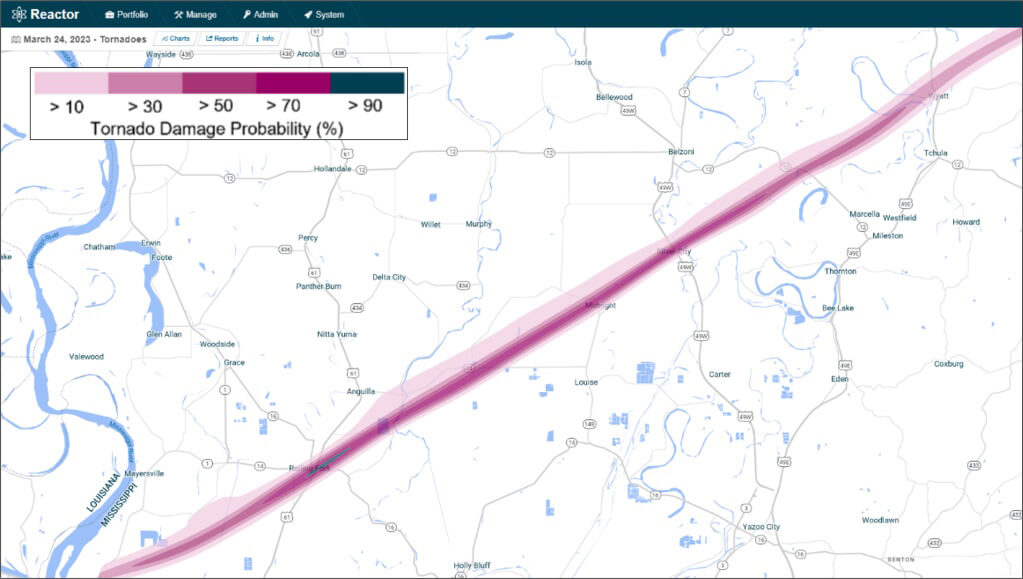
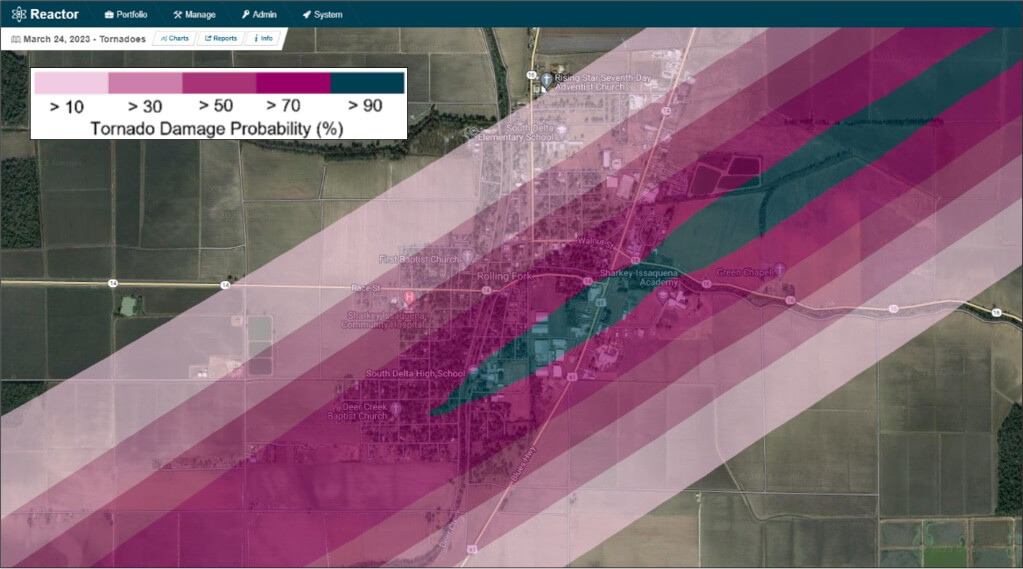
It is important to clarify that the probability values do not indicate the severity of the damage. Instead, they reflect the likelihood that a property was within the tornado’s path. CoreLogic Tornado Forensics Technology captured the tornado’s path as it traveled through Rolling Fork. Figure 1 provides a map of the tornado’s path, accompanied by the probability of damage, as visualized in CoreLogic Reactor.
Table 1: Number & Total Reconstruction Value (RCV) of Residential Properties in Monroe and Sharkey Counties Within Tornado Path by Probability of Tornadic Damage
| Monroe County | Probability of Damage | Property Count | RCV (Millions of Dollars) |
| >10% | 718 | 173 | |
| >30% | 344 | 83 | |
| >50% | 281 | 73 | |
| >70% | 256 | 67 | |
| >90% | 14 | 3 | |
| Total | 1,613 | 400 |
| Sharkey County | Probability of Damage | Property Count | RCV (Millions of Dollars) |
| >10% | 149 | 26 | |
| >30% | 174 | 25 | |
| >50% | 146 | 24 | |
| >70% | 288 | 46 | |
| >90% | 29 | 6 | |
| Total | 786 | 128 |
Please note that not all properties within the tornado’s footprint sustained damage, and the degree of damage to structures may vary. A damaged structure may not have incurred a total loss equal to the full RCV. The number of damaged properties will be a subset of the total 4,100 homes within the tornado’s path.
Figure 1: March 24 EF-4 Tornado Path Crossing Rolling Fork as Viewed in CoreLogic Reactor


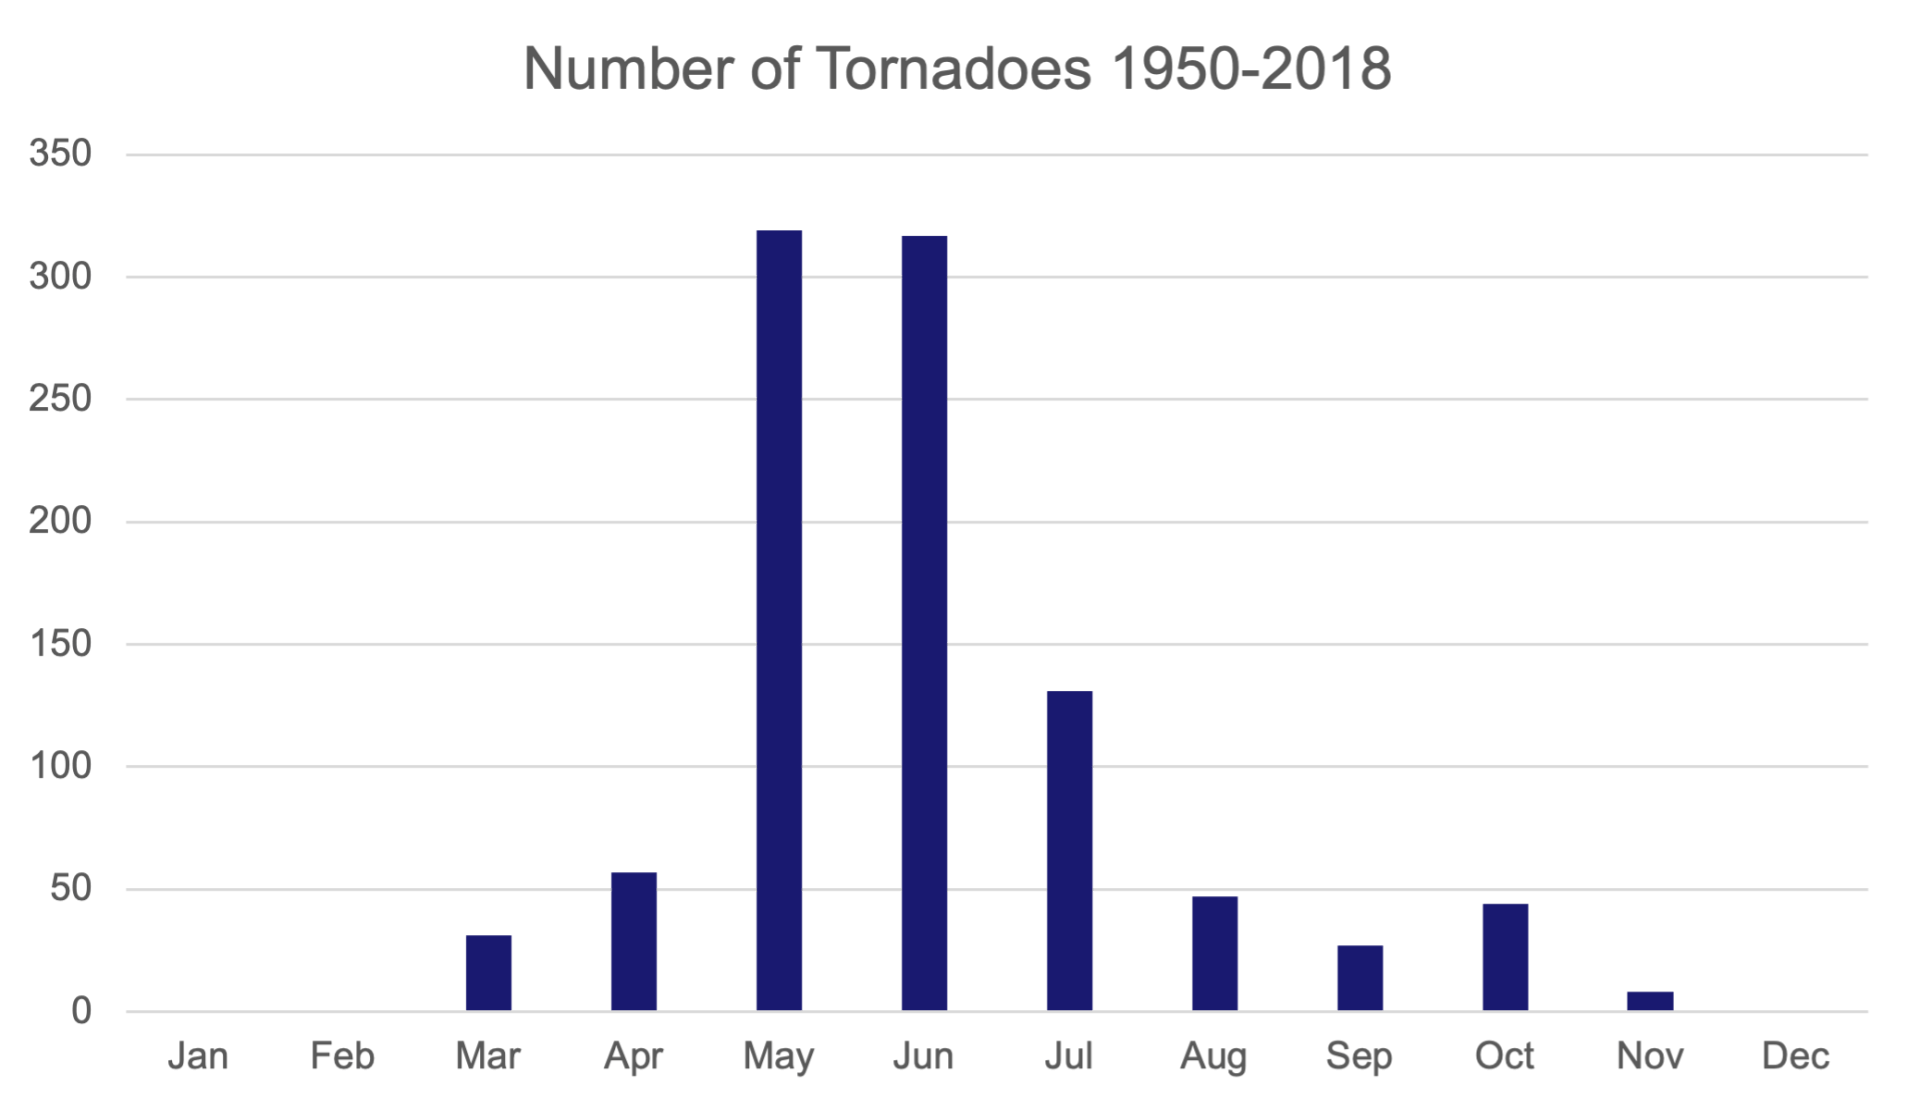
Historically, peak tornado season in the U.S. spans from March through June, with regional variations in peak months. Figure 2 presents data from 1950 to 2018, which shows a significant increase in tornado activity during the spring season.
Figure 2: Number of U.S. Tornadoes Reported Each Month Between 1950 and 2018

Visualize Hazard Footprints and Manage Your Portfolio With ReactorTM
CoreLogic Reactor is an interactive, geospatial mapping solution that provides forecasting, as well as real-time and forensic weather data to users all from a single platform. Users can visualize storm warnings, watches and alerts, as well as impacts in the aftermath of activity. Such data includes tropical storm and hurricane wind speeds at the parcel level.
Wind speed and tornado footprints are powered by CoreLogic Weather Verification Services (WVS). CoreLogic WVS combines the best aspects of point observations — providing a high degree of accuracy — and radar technology (high-resolution patterns) using its proprietary algorithms to generate wind speed maps with neighborhood-level detail (500-meter resolution). These digital tools offer 100% coverage of the continental U.S.
Please email [email protected] with questions regarding the recent severe weather in Mississippi or any CoreLogic event response notifications.
Visit www.hazardhq.com for updates and information on catastrophes across the globe.


