Loans originated in 2015 and 2016 have performed better than loans originated in 2017 and 2018
The CoreLogic Loan Performance Insights Report analyzes mortgage performance for all home loans. Based on this report, the serious delinquency rate for October 2019 was 1.3 percent, representing a 0.2 percentage point decline compared with October 2018.[1] The strong labor market and rise in home prices have helped reduce this delinquency rate. To further examine how product mix or loan vintage contributes to the national delinquency rate, this blog explores trends in the default experience over time by loan type.

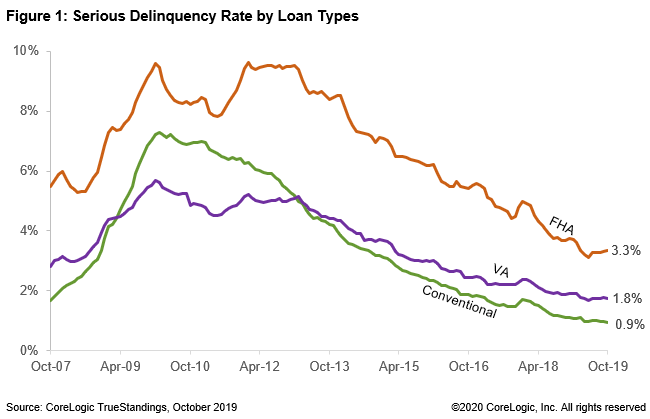
As of October 2019, the serious delinquency rates for Federal Housing Administration (FHA), U.S. Department of Veterans Affairs (VA), and conventional loans were 3.3%, 1.8%, and 0.9%, respectively (Figure 1). The serious delinquency rate dropped for each loan type in October 2019 compared with October 2018. Comparing successive Octobers, the serious delinquency rates are at a 20-year low.
CoreLogic data shows the serious delinquency rate for FHA loans is more than three times higher than the serious delinquency rate for conventional loans. Part of it could be the rise in FHA to conventional refinancing since 2013, which has transferred a large number of current FHA loans into the conventional servicing book and left higher-risk FHA loans outstanding. FHA to conventional refinances accounted for about ten percent of all refinances in 2017 and 2018 compared with just 2 percent in 2011 and 2012.[2] Between 2016 and 2018, about 740,000 borrowers refinanced from FHA to conventional. By FHA to conventional refinancing, borrowers with a good payment history and at least 20 percent home equity can eliminate their mortgage insurance premium.

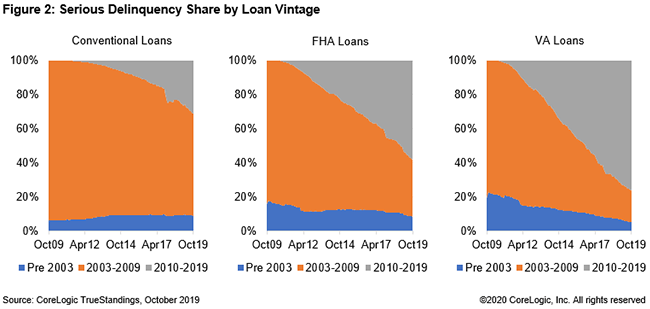
A closer look reveals that today’s delinquency rates for all loan types are heavily influenced by older loans. The bulk of conventional loans that were seriously delinquent were originated between 2003 and 2009 (Figure 2). About 60 percent of the conventional loans that were seriously delinquent in October 2019 were originated between 2003 and 2009 compared to just 31 percent originated between 2010 and 2019. However, the delinquency rates for government loans were influenced by comparatively more recent loans. About 58 percent of the FHA loans and 76 percent of VA loans that were seriously delinquent were originated between 2010 and 2019.

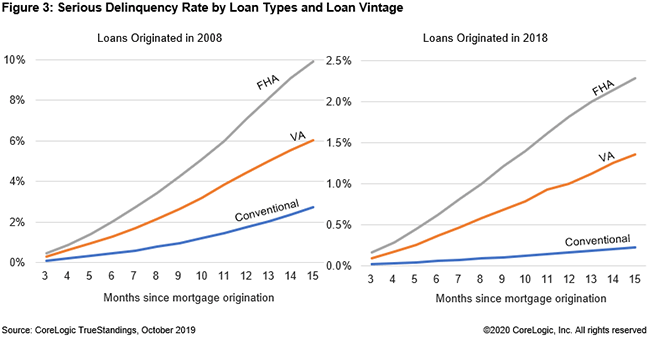
Figure 3 compares the serious delinquency pattern by loan type and origination year.[3] Each line in the figure represents the serious delinquency rate for loans originated in a given year as a function of number of months since the loan was originated. Analyzing these vintages imparts three important trends. First, delinquency rates were much higher for all loan types originated between 2006 and 2008. Performance of all types of loans started to improve gradually beginning with the 2009 vintage as the underwriting standards tightened and the economic recovery began mid-2009.[4] Second, the delinquency rate for government loans was higher than conventional. Third, in general, loans originated in 2015 and 2016 have performed the best, with the lowest 15-month delinquency rate in a decade. Delinquency rates were slightly higher for all loan types originated in 2018 compared to originated in 2017.[5]
[1] Serious delinquency is defined as 90 days or more past due or in foreclosure proceedings.
[2] Based on CoreLogic public record data.
[3] Only 2008 and 2018 vintages are shown in Figure 3. However, for the analysis serious delinquency pattern for each vintage from 2006 to 2018 were compared.
[4] The National Bureau of Economic Research has identified the January 2008 through June 2009 period as an economic recession, and recovery began July 2009; see http://www.nber.org/cycles.html.
[5] Texas, Florida and Puerto Rico were excluded in the comparison of the national delinquency rate for yearly vintages to avoid the effects of the 2017 natural hazards.


