Homeowners in pricey counties and ZIP codes largely see the highest annual property tax bills in the country
A recent CoreLogic analysis showed that at the state level, average property taxes paid by homeowners vary from $694 per year in West Virginia to $8,498 in New Jersey. Property taxes are levied proportionally to home values, so such differences by state largely reflect variances in home values and property tax rates.
In West Virginia, for instance, the median home price in 2023 was $154,500, whereas New Jersey had a median price of $439,000. The differences in states’ property-tax rates range from as low as an average of 0.3% in Hawaii, 0.4% in Idaho and 0.5% in Alabama, to 3.2% in Connecticut; 2.7% in Delaware; 2.5% in Pennsylvania; and 2.4% in New Jersey, New York and Illinois.
But states calculate property taxes differently by municipalities, as home prices and rates can vary greatly locally. In West Virginia, for example, average annual property taxes range from about $210 in McDowell and Webster counties to about $1,856 in Jefferson County. Similarly, in New Jersey, average property taxes in 2023 were between $4,590 in Cumberland County to about $11,350 in Essex and Bergen counties.
A Look at the Top 15 Highest Property Tax Counties in the U.S.
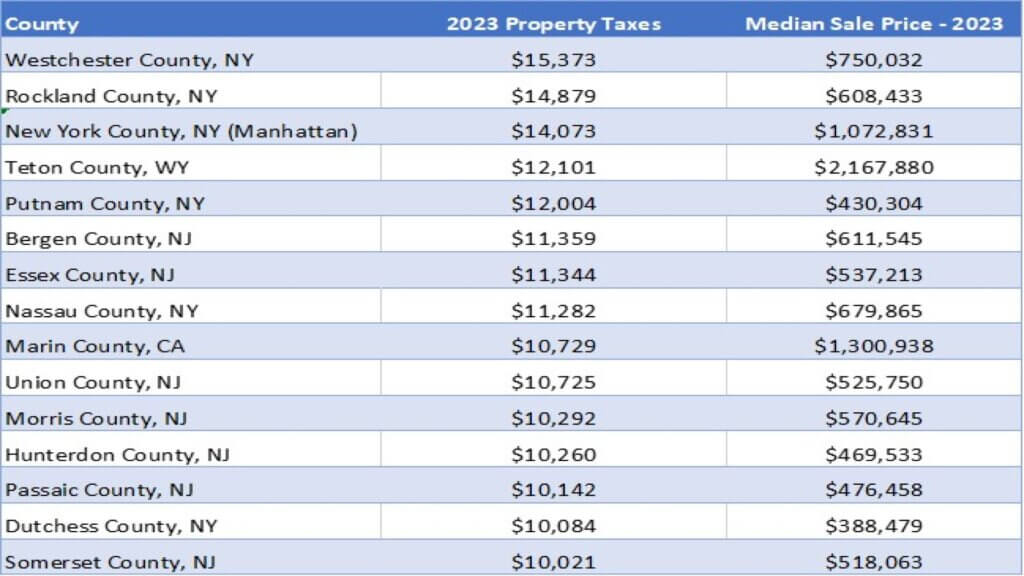
Using CoreLogic’s 2023 property-assessment data, Table 1 lists the top 15 U.S. counties where median property tax bills are the highest. They are largely concentrated in New York and New Jersey, unsurprising given that these states have some of the most expensive housing markets in the country and high costs of living.
The top three spots go exclusively to high-priced counties in New York: Westchester, Rockland and New York (Manhattan) counties, where median property taxes reached more than $14,000 in 2023. In fourth place is Teton County, Wyoming, home to Grand Teton National Park and skiing mecca Jackson Hole, where median property taxes are higher than $12,000 and the typical home has an assessed market value above $2 million. New York’s Putnam County takes the No. 5 spot, having average property tax bills of about $12,000.
The next 10 counties are also almost exclusively in New York or New Jersey, except for Marin County, California, where the median home price in 2023 was $1.3 million. Under Proposition 13, homeowners in California pay relatively modest property taxes, despite the fact that the Golden State has one of the country’s highest homebuying costs.

A Look at the 15 Highest Property Tax ZIP Codes in the U.S.
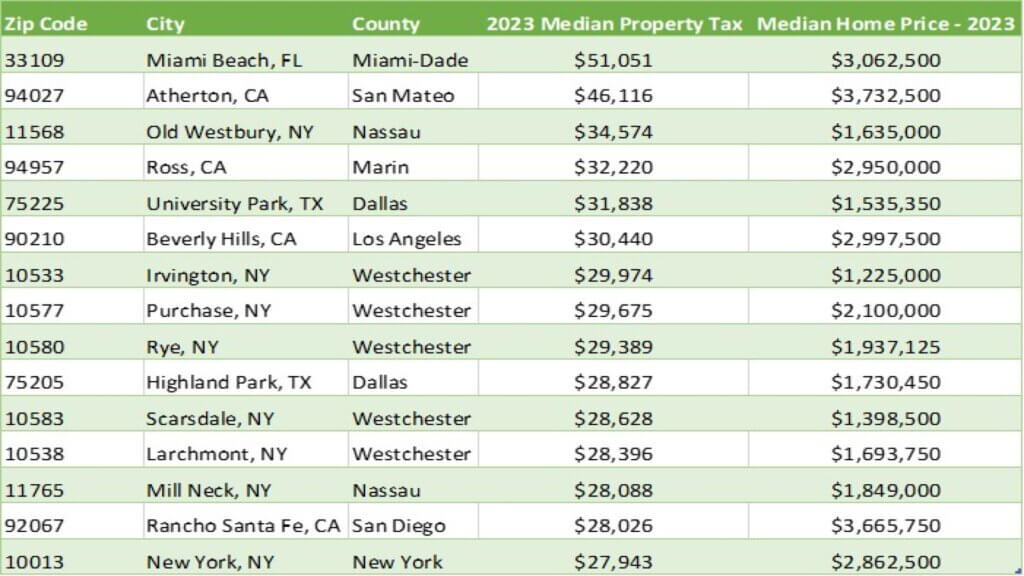
Based on a homeowner’s annual property tax bill, Table 2 shows the most expensive ZIP codes in which to own a home, where even modest houses sell for millions of dollars. Miami Beach takes the No. 1 spot, with a median property tax bill of about $51,000 and a median home price of above $3 million.
Four California communities landed on the list. Atherton, a Silicon Valley suburb known as one of the nation’s wealthiest communities, took the second position, followed by Marin County’s Ross (No. 4), Los Angeles County’s Beverly Hills (No. 6) and Rancho Santa Fe in San Diego County (No. 14).
Although Texas is not always associated with a high cost of living, the Dallas-area communities of University Park (No. 5) and Highland Park (No. 10), together known as Park Cities, are also expensive neighborhoods for homeownership, with median property tax bills of about $30,000 per year. New York communities took the remaining eight spots, where typical property tax costs also ran about $30,000 in 2023.

CoreLogic’s Office of the Chief Economist’s home page has the latest commentary from our team of housing market experts, including our monthly market reports, as well as analyses on other key topics such as property taxes, generational homebuying trends and investor activity.
©2024 CoreLogic, Inc. All rights reserved. The CoreLogic content and information in this blog post may not be reproduced or used in any form without express accreditation to CoreLogic as the source of the content. While all of the content and information in this blog post is believed to be accurate, the content and information is provided “as is” with no guarantee, representation, or warranty, express or implied, of any kind including but not limited to as to the merchantability, non-infringement of intellectual property rights, completeness, accuracy, applicability, or fitness, in connection with the content or information or the products referenced and assumes no responsibility or liability whatsoever for the content or information or the products referenced or any reliance thereon. CoreLogic® and the CoreLogic logo are the trademarks of CoreLogic, Inc. or its affiliates or subsidiaries. Other trade names or trademarks referenced are the property of their respective owners.


