Most areas show balance between price gain, cap rate drop and net revenue rise

Home prices rose a whopping 20% over the past year and rents on single-family homes were up 13%, according to the CoreLogic national Home Price Index and Single-Family Rent Index. With prices up more than rent, is it a sign that homes are overvalued?
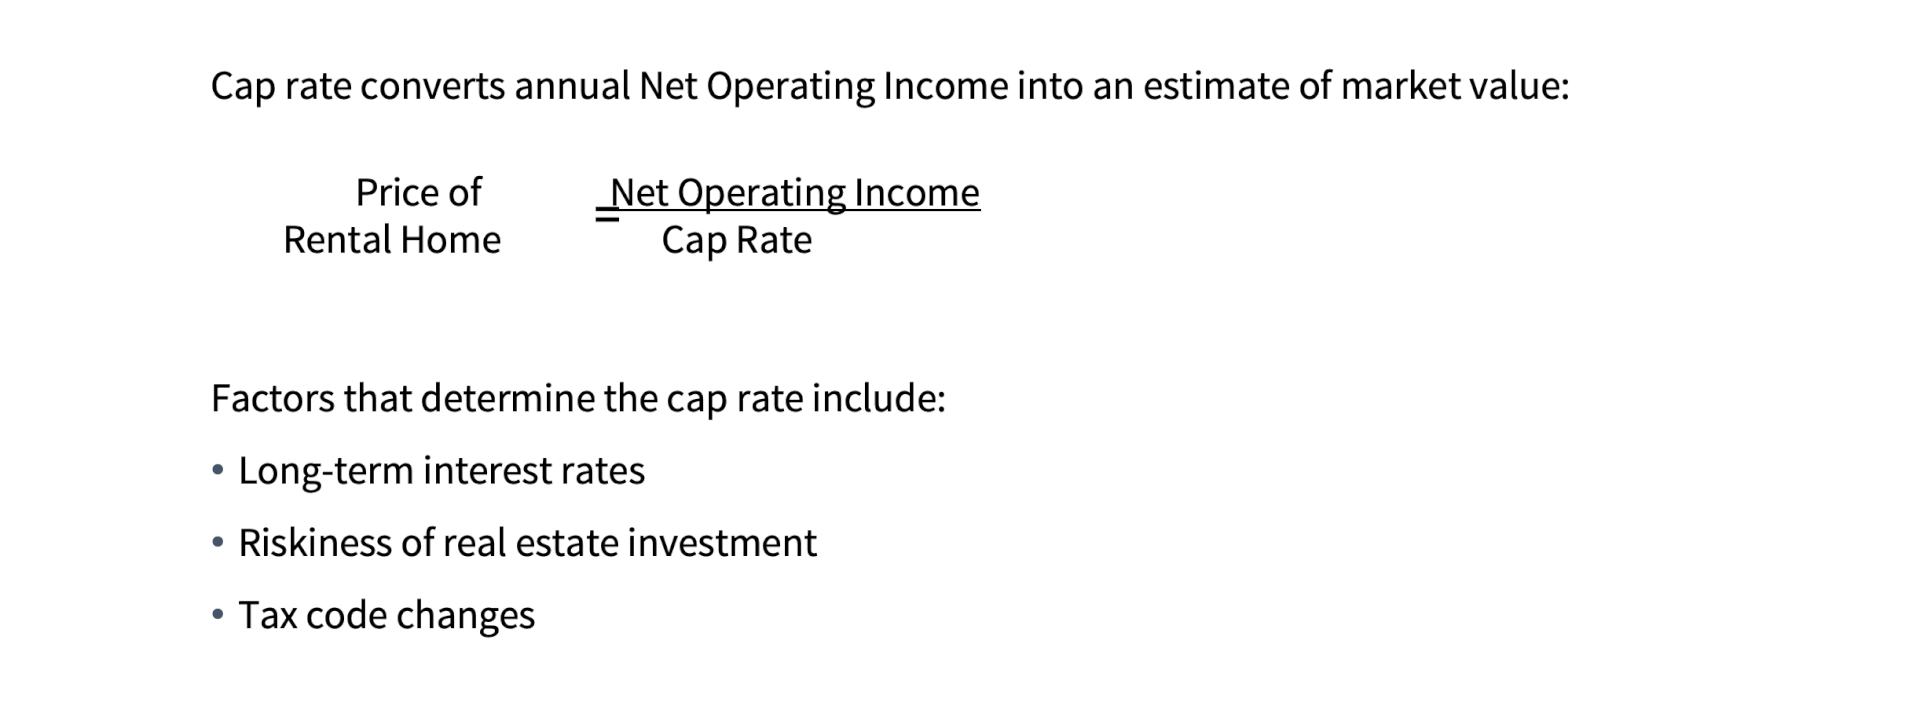
Price growth that outstrips rent gains over an extended period could be a sign that homes are overvalued if capitalization rates, otherwise called cap rates, had remained unchanged. A cap rate is used by real estate professionals to convert net operating income on an investment property into a market value. When cap rates decline, the market value of a rental home increases.
Figure 1: What Affects Capitalization (Cap) Rates?

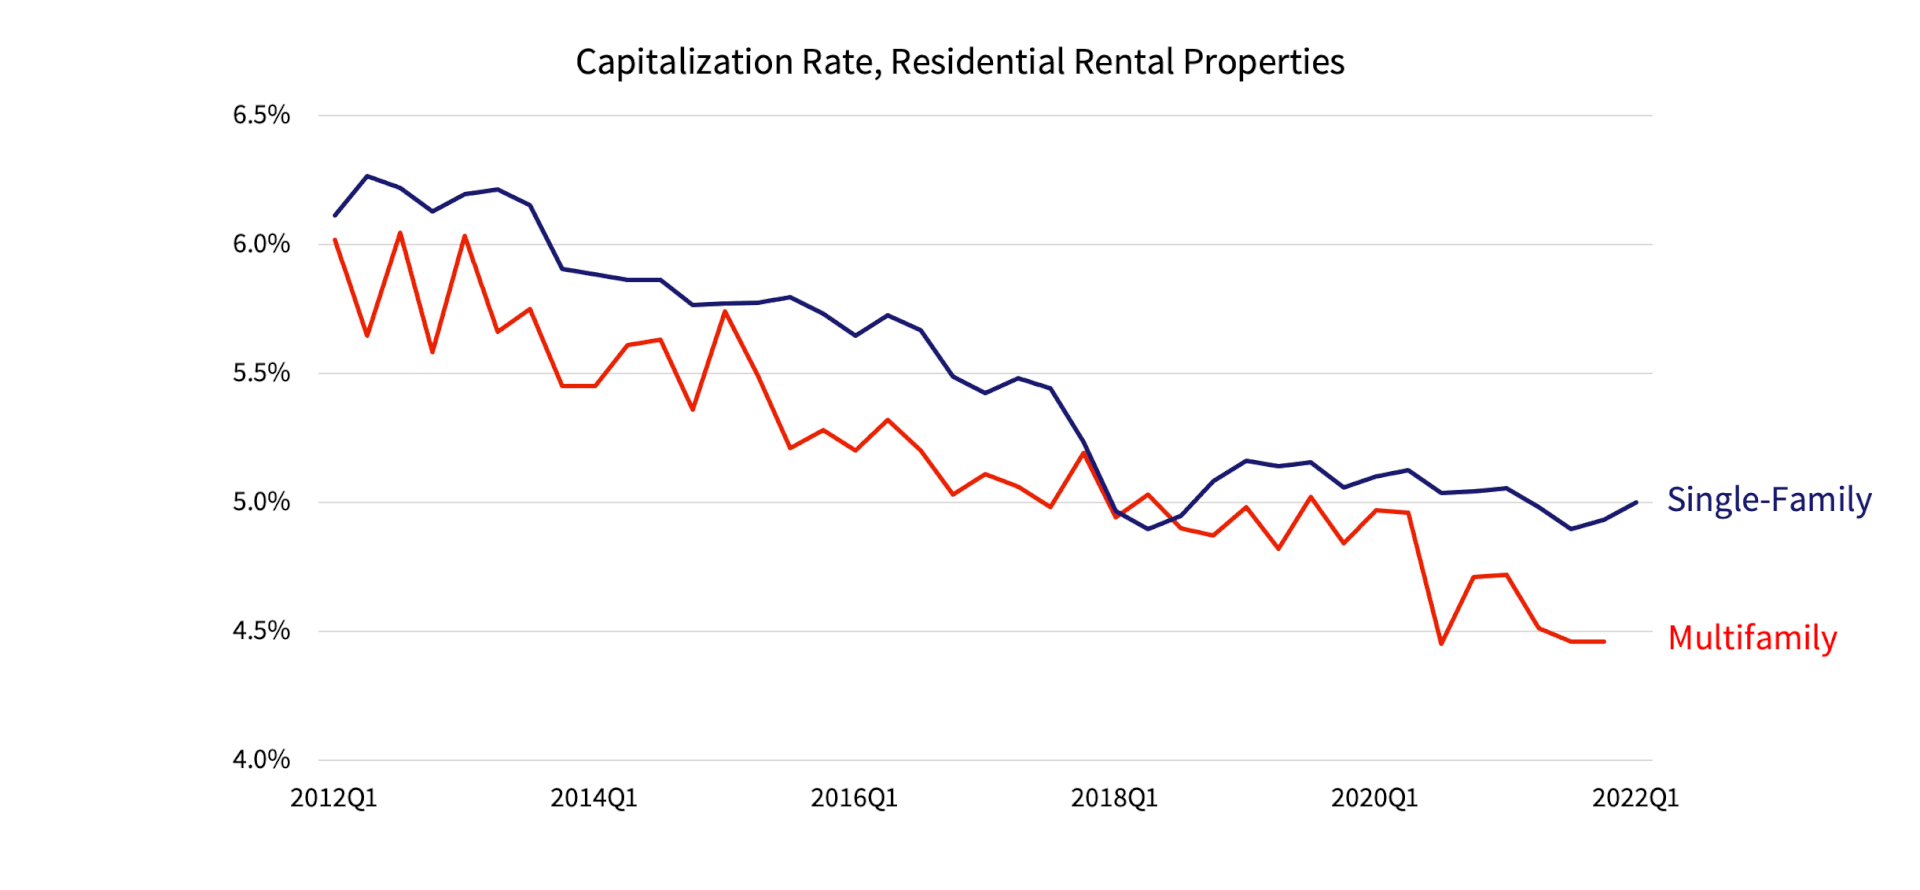
While a cap rate is relatively stable over short periods within a metro area, cap rates will vary across metros and over long periods. Over sustained time horizons, cap rates fluctuate based on the level of long-term interest rates, the perceived riskiness of real estate investments and tax code changes that affect real estate profitability. Of these three factors, the one that has changed the most during the last two decades is long-term interest rates. Consequently, cap rates for single-family rental homes dropped by nearly 20% during the last decade, and by almost 50% from 20 years ago.
Figure 2: Cap Rates Have Fallen About 20% During the Last Decade

This cap rate decline implies that prices can rise significantly even with no change in net operating income and the local market would not be overvalued. If net operating income also rose, then that would raise the price of single-family rental homes further.
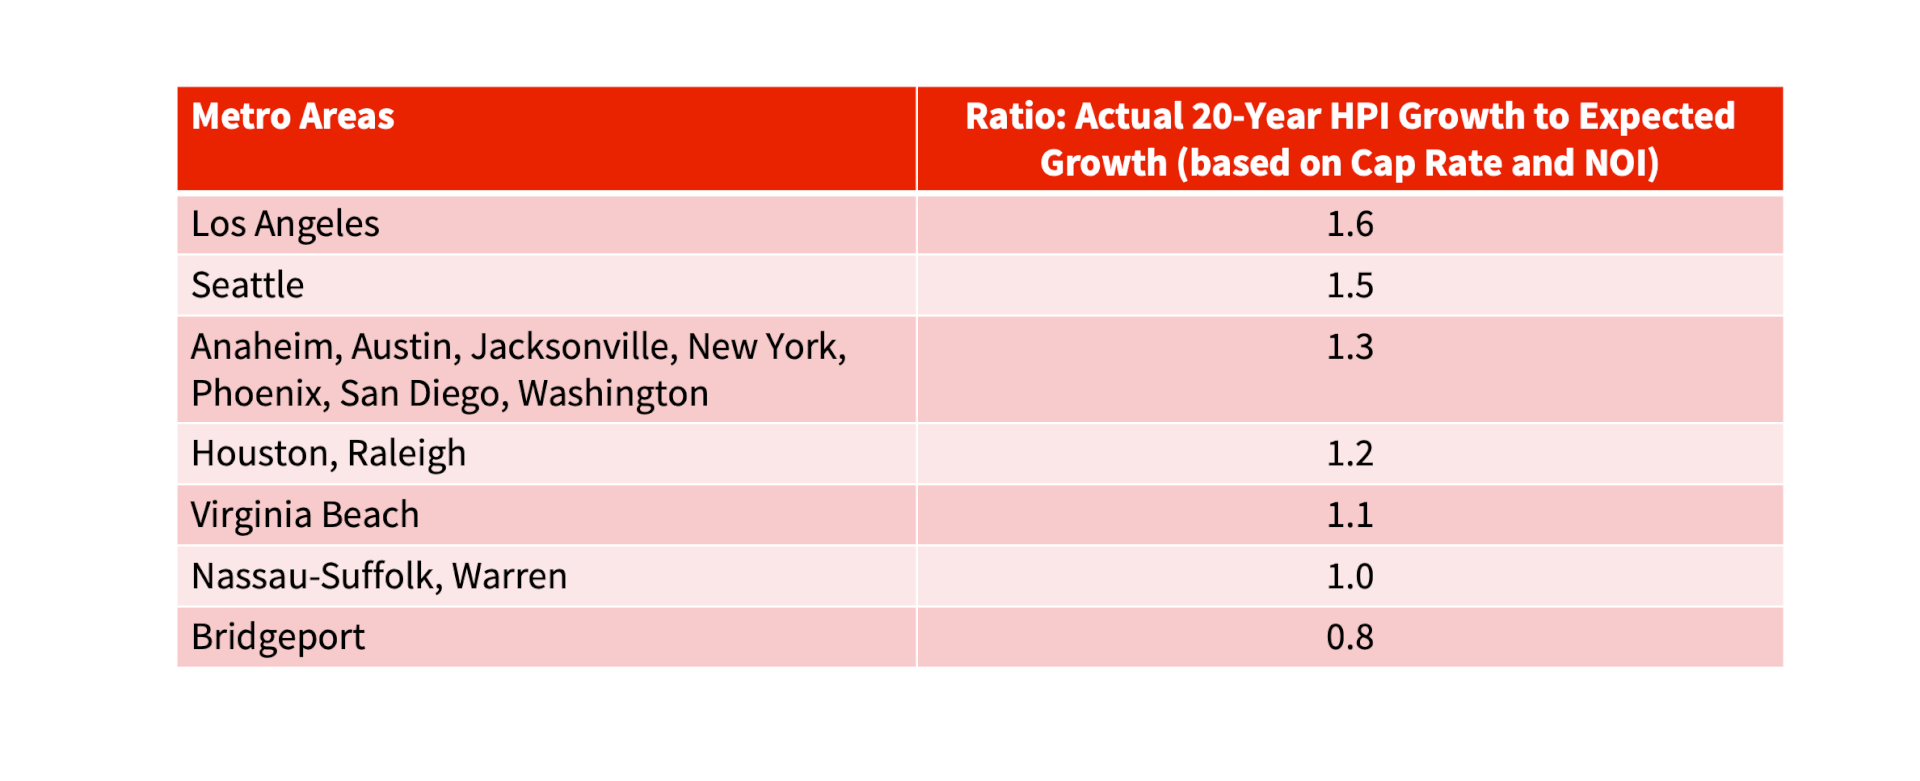
Using rent increases adjusted for inflation as a proxy for net operating income growth, we can compare home prices, net operating income and cap rate changes over time. In doing so, we find that single-family home prices in most metros appear to have been anchored in economic fundamentals.
Figure 3: Most Metros Had Price Growth Consistent with Cap Rate and Net Operating Income Change

The Los Angeles and Seattle metros may be an exception. Price gains during the last 20 years appear to have exceeded what may have been expected given the decline in cap rates and estimated change in net rental income.
Analysis of over- or under-valued markets should not rely on one metric but should be based on several measurements. Comparing price with rent growth is one such indicator.
Summary:
- In most areas of the U.S., price growth has exceeded rent gains in national indexes.
- Price gains exceeding rent growth may be a sign of overvaluation if cap rates remain constant.
- Cap rates are nearly 20% lower than 10 years ago and almost 50% lower than 20 years ago.
- For most places, price gains are generally in line with estimates of net revenue rises and cap rate drops.
Methodology: The numerator of the ratios in Figure 3 equals the CoreLogic Home Price Index (HPI) for homes with a sales price between more than 75% of the local area median price and less than or equal to the local area median sales price for 2022Q1 divided by 2002Q1; the first quarter value was calculated using the average of the January through March HPI for each metropolitan area (May 3, 2022 HPI release). This price interval was chosen because the median price of single-family rental homes is generally within this price range.
The denominator of the ratios in Figure 3 is the estimate of the change in market value based on the change in Net Operating Income (NOI) and change in capitalization (cap) rates between 2002Q1 and 2022Q1. The change in NOI was proxied by the change in inflation-adjusted rent, which was calculated using the CoreLogic Single-Family Rent Index to represent the rent change for each metropolitan area and the Consumer Price Index (all items less shelter in U.S. city average, all urban consumers, not seasonally adjusted) to adjust for inflation. The change in cap rate equals the American Council of Life Insurers’ Commercial Mortgage Commitment (CMC) estimate for multifamily properties for 2002Q1, with an estimate for 2022Q1 based on the relationship between the CMC multi-family cap rate and the CoreLogic Rental Trends cap rate for three-bedroom, single-family rental homes; both cap rate series are quarterly averages of national data.

