


Defined Regions
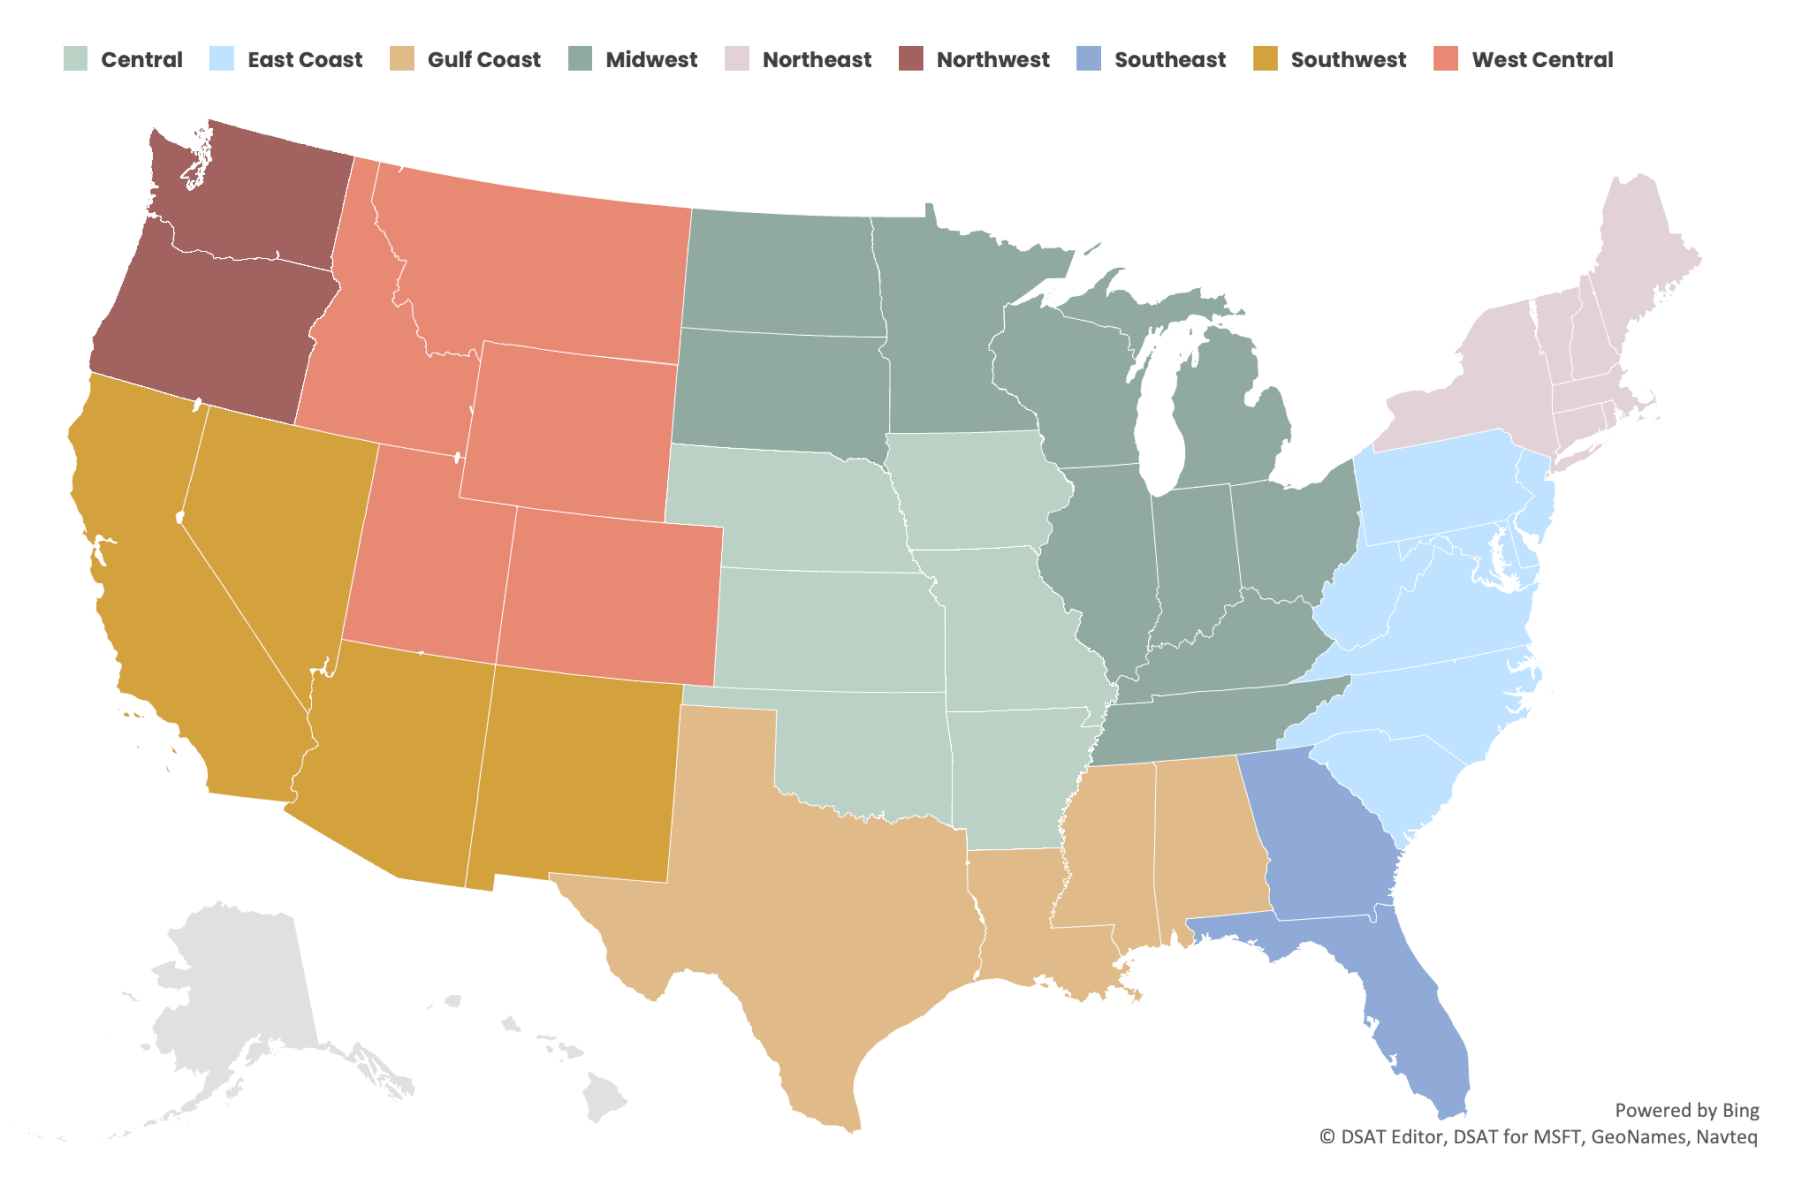
CoreLogic curates this monthly bulletin of regional construction cost insights, which are reflected in the CoreLogic Claims Pricing Database. We combine the current month’s pricing data with four common loss scenarios to create models illustrating market impacts that are applied across nine regions and compared month over month and year over year.
Our experts provide detailed analyses of changes and trends to provide additional insight into key drivers. View our Construction Database Pricing Methodology white paper to gain additional insight into how we populate cost values.
Pricing Insights
As 2025 begins, the CoreLogic Pricing Analysis and Delivery Team continues researching and surveying labor costs and industry best practices across all construction categories in the Claims Construction Cost Database.
In February, CoreLogic will refresh line item and action descriptions for the Mitigation, Appliances, and Wallpaper & Wall Carpet categories. The March release will update the following categories: Permits & Fees, Temporary Repairs, Stairs, and Toilet & Bath Accessories. The realignment process will continue each month, with all categories targeted for completion by Q2 2025.
Along with these database updates, labor pricing in Greater Los Angeles and surrounding areas will rise to reflect increased demand and other factors related to the January 2025 Southern California Wildfires.
CoreLogic has updated the Claims Construction Pricing Database Methodology white paper to include additional considerations not previously outlined.
Fire/Lightning (Large Loss) Insights: 12-Month Trend

In this category, large loss claims are modeled from a typical fire loss where all components of a home’s construction are affected. Losses typically exceed $100,000.
- Since February 2024, the loss scenario has increased by 13.2%, driven by higher drywall material costs and rising labor expenses across all trades. The annual drywall price adjustment from October 2024 continues to push costs upward, while steady labor rate increases have further contributed to overall construction expenses.
| Material | Average Change From February 2024 Pricing |
| Drywall Labor | 9.6% |
| Labor | 20.5% |
| Drywall Materials | 9.9% |
| Finish Carpentry Materials | 6% |
| Framing Materials | -0.9% |
- Compared to last month, the fire/lightning loss scenario declined by 2.1% on average. The Northwest saw the largest increase at 2.06%, followed by the Gulf Coast (0.88%) and the Midwest (0.80%). Meanwhile, the Northeast recorded a significant drop of 28.5%.
Wind/Hail (Exterior/Roof) Insights: 12-Month Trend

This category represents losses due to wind and/or hail weather activity. Restoration from this damage requires roof replacement, partial siding replacement, and accompanying accessories.
- Over the past year, rising labor and material costs have driven a 15.4% increase in the loss scenario. Siding labor climbed 17.6%, while roofing labor rose 13.9%. Material prices also followed an upward trend. Fencing increased 12.4%, siding was up 8.7%, and roofing rose 4.4%.
- Material costs grew 2.6% month-over-month, with regional variations. The West Central and Northwest regions saw the largest increases at 26% and 23%, respectively. This was mainly due to rising labor expenses and moderate material price hikes. Meanwhile, the Southeast and the Gulf Coast experienced steadier growth at 15% and 11%, reflecting regional differences in demand and supply.
Water (Interior Reconstruction) Insights: 12-Month Trend

Moderately complex losses are modeled for the interior water loss scenario using the bathroom as the origin of loss where a combination of replacement and repair of common household finishes is required.
- Water (interior reconstruction) loss scenario prices have increased by 0.76% per month, with an average annual growth of 15%. The table highlights key categories contributing to this trend.
| Category | Average Change From February 2024 |
| Painting Labor | 12.5% |
| Cleaning Labor | 16.7% |
| Drywall Materials | 9.9% |
| Insulation Materials | 8.8% |
- Since February 2024, pricing for this loss scenario has risen fastest in the Northwest (22%) and West Central (24%) regions. This growth stems from sharp increases in cleaning and painting labor. Cleaning labor rose 25.3% in the West Central and 23.1% in the Northwest. Painting labor climbed 19% in the Northwest and 26.7% in the West Central region.
Water Mitigation (Drying) Insights: 12-Month Trend

Typical drying costs for a residential structure include water extraction, removal of wet material, and drying equipment usage.
- Water mitigation costs increased by 12.8% over the past year, with the West Central region leading at 22%, followed by the Northwest at 21%. Strong demand in the Southeast (14%) and Midwest (12%) contributed to steady growth in those regions.
- The Southwest (12%), Northeast (11%), and East Coast (9%) experienced more gradual changes, maintaining stable trends. The Gulf Coast and Central regions saw steady increases of 7% and 8%.
- Water mitigation labor costs rose by 14.9% over the past year. The West Central and Southeast regions experienced the most significant growth, likely due to increased demand and regional economic factors. In contrast, the Gulf Coast maintained steadier trends, possibly due to stable infrastructure and labor markets.
About CoreLogic Data Research
CoreLogic develops this report using up-to-date materials and labor costs. CoreLogic’s team of analysts continuously researches hard costs such as labor, material, and equipment, including mark-ups. CoreLogic updates its database every month accordingly.
Our research also covers soft costs, such as taxes and fringe benefits, for reconstruction work performed as part of the insurance industry. CoreLogic monitors demographics and econometric statistics, government indicators, and localization requirements, including market trends from thousands of unique economies throughout the U.S.
Other factors in this process include the following:
- Wage rates for more than 85 union and non-union trades
- Over 100,000 construction data points
- Productivity rates and crew sizes
- Building code requirements and localized cost variables
Additionally, we validate cost data by analyzing field inspection records, contractor estimates, phone surveys, and both partial and complete loss claim information.
Please complete the online form to provide feedback or request information on any items in our construction database. Please contact your sales executive or account manager for additional explanations or questions. A more detailed methodology explanation can be found in our Construction Database Pricing Methodology white paper.
About CoreLogic
CoreLogic is a leading global property information, analytics and data-enabled solutions provider. The company’s combined data from public, contributory and proprietary sources includes over 4.5 billion records spanning more than 50 years, providing detailed coverage of property, mortgages and other encumbrances, consumer credit, tenancy, location, hazard risk and related performance information. The markets CoreLogic serves include real estate and mortgage finance, insurance, capital markets, and the public sector. CoreLogic delivers value to clients through unique data, analytics, workflow technology, advisory and managed services. Clients rely on CoreLogic to help identify and manage growth opportunities, improve performance and mitigate risk. Headquartered in Irvine, Calif., CoreLogic operates in North America, Western Europe and Asia Pacific. For more information, please visit www.corelogic.com.
NOTE: The building material, labor, and other cost information in this bulletin is generated using research, sources, and methods current as of the date of this bulletin and is intended only to provide an estimated average of reconstruction cost trends in the specified general geographic regions of the United States. This cost information may vary further when adjusting claim values for specific property locations or specific business conditions.


