Both income and debt increased for first-time homebuyers in 2023
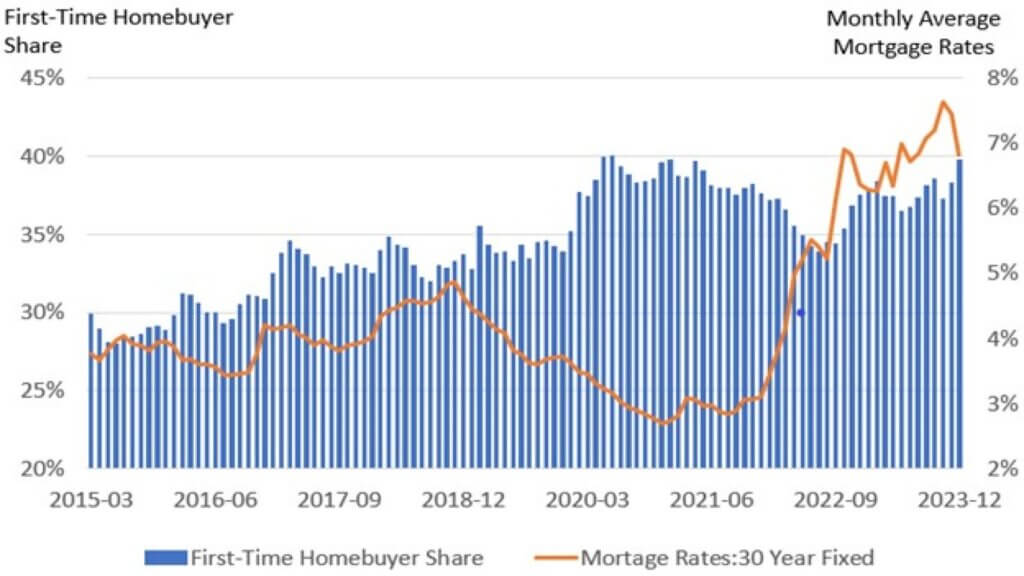
According to CoreLogic Fraud Consortium Loan Application data [1], the share of U.S. first-time homebuyer (FTHB) applications surged to 39% in 2020, up from about 29% in 2015 (Figure 1). Since then, FTHBs have been a growing share of the homebuying population who purchase with a mortgage, a trend that accelerated in 2020. The average age of FTHBs is 34, and most are millennials and Generation Z.
However, the FTHB share dropped to 34% during the third quarter of 2022, a three-year low, as mortgage rates surged to the highest level in almost 25 years. In 2023, the FTHB share hovered at around 38%.
FTHB Share Compared With Mortgage Rate Changes
The increase in the FTHB share tracks closely with the decline in mortgage rates in early 2019, when the number of FTHBs started to rise. During the pandemic, exceptionally low interest rates lessened housing affordability challenges, especially for FTHBs. Though home prices were rising, record-low interest rate helped FTHBs offset that appreciation. As a result, the FTHB share increased to a 10-year high of 40% during 2021.
However, interest rates began climbing in early 2022 and reached 5% in April of that year. Rapidly rising rates and higher home prices eroded housing affordability and dissuaded potential FTHBs from entering the market, causing the FTHB application share to drop to a pre-pandemic low of 34% in September 2022. Mortgage rates continued to rise and reached a peak of almost 7% in October 2022. Figure 1 shows that FTHB demand has a somewhat inverse relationship with mortgage rate movements.

With rapidly increasing mortgage rates, housing demand started to decrease, which slowed homebuying activity. Decelerating home prices and slightly improved housing affordability helped some FTHBs, as many existing owners decided to wait for mortgage rates to decline. As most existing homeowners have locked in a mortgage rate of 5% or less, there is little incentive to give up that low rate, and as such they tend to hold on to properties. With less competition among move-up homebuyers and slightly improving housing affordability, the FTHB share began to bounce back in November 2022 and again reached 40% in December 2023.
In the changing landscape of housing affordability, which is marked by persistently higher mortgage rates and escalating home prices, the loan characteristics and attributes of borrowers have changed in recent years. Notably, individuals with relatively modest incomes have increasingly refrained from applying for home loans.
The share of FTHBs with annual incomes of less than $100,000 dropped by more than 25 percentage points from 2019 to 38% in 2023. The average income of FTHBs seeking a loan surged by 46% from 2019 to almost $140,000 in 2023. Concurrently, the average home price for FTHBs applying for a loan experienced a notable 51% increase during that period to about $440,000.
Major Criteria for Obtaining a Home Loan: 2016 – 2023
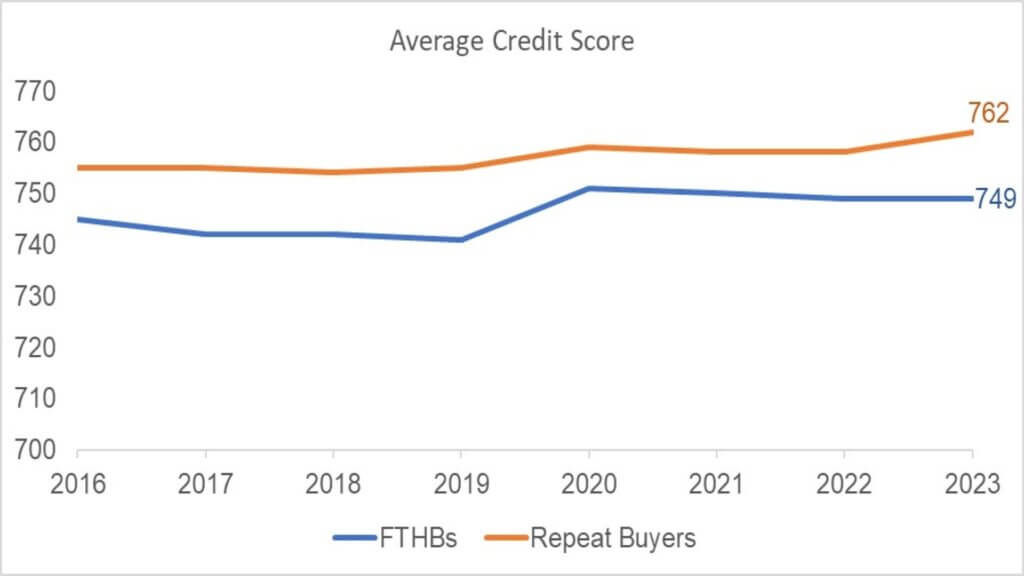
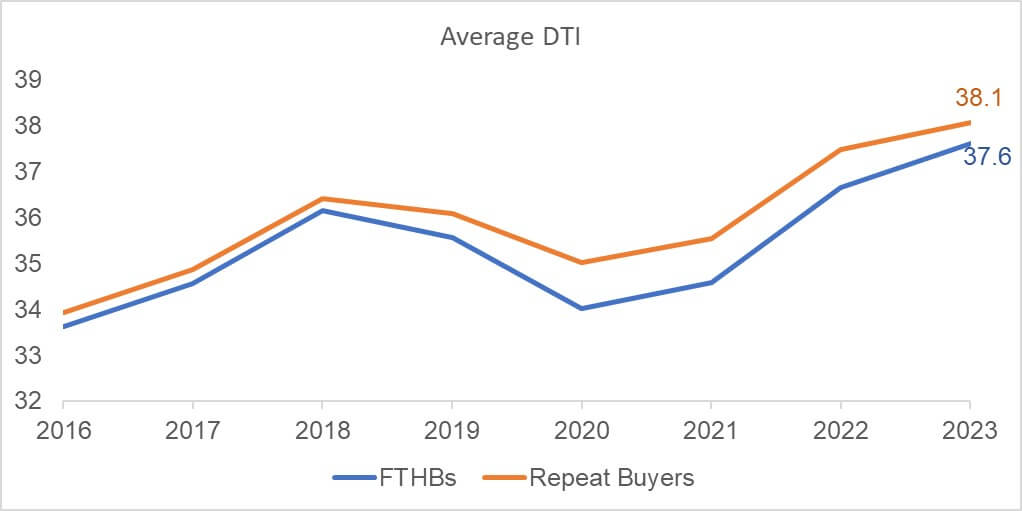
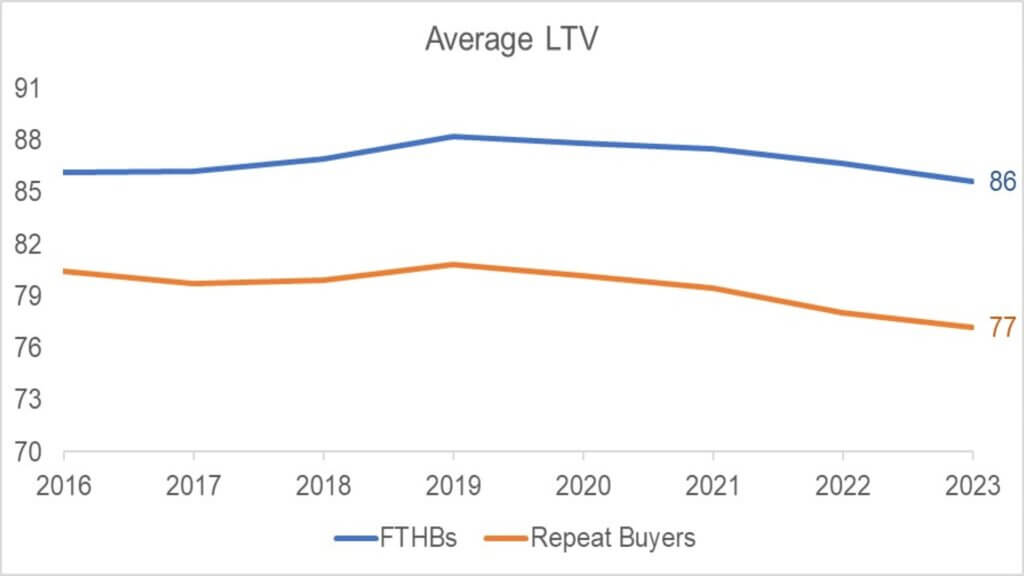
The charts below illustrate the trend of three major underwriting factors for all home purchase loans: credit score (Figure 2), debt-to-income (DTI) ratio (Figure 3) and loan-to-value (LTV) ratio (Figure 4), for both FTHBs and repeat buyers. Although the average credit score of FTHBs applying for a loan has remained relatively consistent compared with previous years, there has been a slight increase for repeat homebuyers. Despite the rise in the average income of FTHBs, the average DTI ratios have steadily increased over the past few years due to the unprecedented surge in home prices. In contrast, LTV ratios have declined for FTHBs in recent years.


Despite housing affordability challenges, the FTHB share is likely to stay at its current level for the foreseeable future. Potential FTHBs who have paused their home searches for a while may enter the housing market soon, while most current owners may wait a little longer to move up until mortgage rates relax.
For more data and commentary about millennial and Gen-Z homebuyers, check out this recent blog post from CoreLogic’s Office of the Chief Economist. And you can also follow all the most recent commentary from our team of housing market experts at this home page.
[1] This analysis is based on all home-purchase mortgage applications, accepted or not, from January 2019 to February 2023. Data excludes investors, second-home buyers and all-cash buyers.
©2024 CoreLogic, Inc. All rights reserved. The CoreLogic content and information in this blog post may not be reproduced or used in any form without express written permission. While all of the content and information in this blog post is believed to be accurate, the content and information is provided “as is” with no guarantee, representation, or warranty, express or implied, of any kind including but not limited to as to the merchantability, non-infringement of intellectual property rights, completeness, accuracy, applicability, or fitness, in connection with the content or information or the products referenced and assumes no responsibility or liability whatsoever for the content or information or the products referenced or any reliance thereon. CoreLogic® and the CoreLogic logo are the trademarks of CoreLogic, Inc. or its affiliates or subsidiaries. Other trade names or trademarks referenced are the property of their respective owners.


