The investor share of purchases climbed to almost 29% in December 2023 and could exceed 30% in 2024
The share of U.S. home investors hit a new high in December, according to CoreLogic data [1]. In October, November and December, the share of single-family home purchases that were made by investors was 28%, 27.3% and 28.7%, respectively. This eclipsed the previous all-time high of 28.3% in February 2022 and makes the investor share rising above 30% in 2024 a distinct possibility.
A Look at Investor Activity Versus Home Price Appreciation: 2019 – 2023
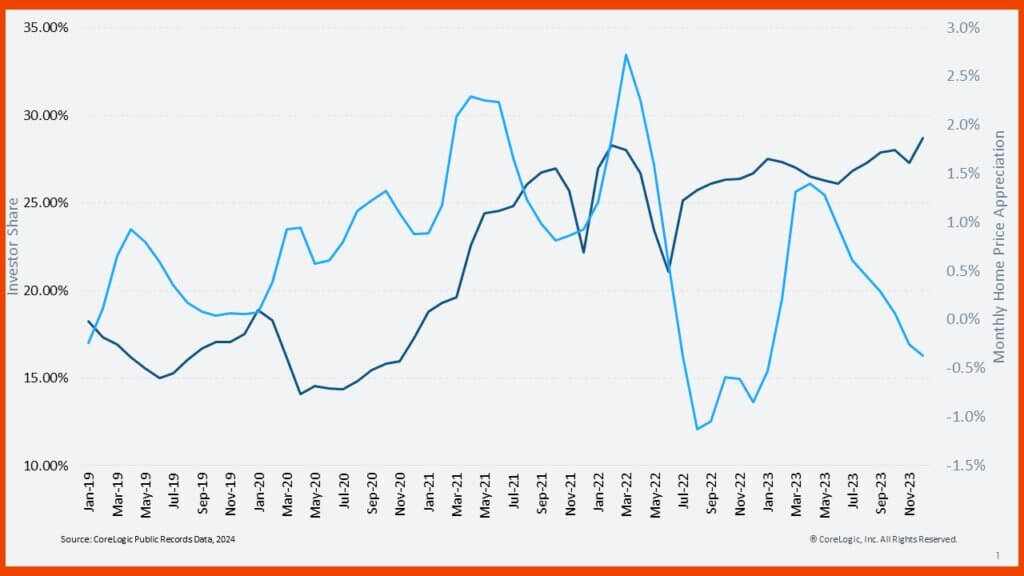
Figure 1 shows the share of purchases made by home investors since January 2019, along with monthly gains according to the U.S. CoreLogic S&P Case-Shiller Index. The connection between price appreciation and investor activity has been inconsistent over the past few years. For instance, in 2019 and 2020, the two metrics always moved in opposite directions, while the intense appreciation of 2021 and 2022 coincided with an unprecedented leap in investor purchases.
However, appreciation has since slowed, but the investor share has remained high. Elevated interest rates have stymied price appreciation but not home investors, and there is no sign that the investor share will fall back to its pre-pandemic level of less than 20% as recorded in the first half of 2023 [2]. Indeed, the Federal Reserve has yet to cut rates, and prices remain high, fueling strong rental demand that investors are seizing upon.
Investor Versus Non-Investor Sales Volume: 2019 – 2023
The sizable home investor share masks what it really a cold market. Figure 2 illustrates the number of U.S. home purchases made by both investors and non-investors through December 2023. Investor purchases are strong only compared with owner-occupied purchases. Home investors made 92,000 purchases in October 2023 before backing off to a respective 80,000 and 79,000 properties in November and December. These numbers are comparable to those recorded in 2022, 2020 and 2019, which show that the true investor surge was in 2021 and that the investor share now is more a sign of their resiliency to high interest rates than owner-occupied buyers.
Investors may have mostly returned to their pre-pandemic levels of activity, but Figure 2 shows a stark contrast to owner-occupied buyers, who are purchasing about 100,000 fewer homes per month than they were before 2022.
![Monthly home purchases made by investors and non-investors [3]: January 2019 – December 2023](https://www.corelogic.com/wp-content/uploads/sites/4/2024/04/Q423_Investor_2-1024x576.jpg)
Investor Share Versus Annual Appreciation by U.S. County: 2019 – 2023
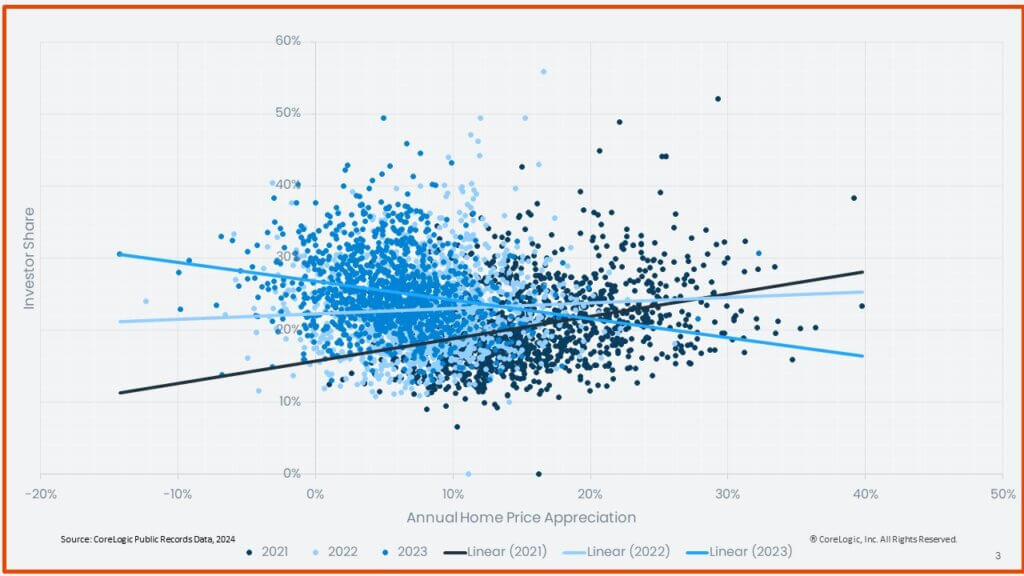
Figure 3 shows annual price appreciation compared with the investor share for each year from 2019 to 2023. Each point on the graph represents an individual county in a particular year. The best-fit lines through the points show the direction of the connection in each year.
In 2021, the line slopes upward, showing that counties with higher appreciation that year had a larger investor presence. In 2022, the line is flatter, showing that a high investor share still predicted strong appreciation but not to the same extent as in 2021. For 2023, the line slopes down, showing that this trend reversed, and higher investor presences predicted lower appreciation last year. This is not to say that investors caused price increases in 2021 and 2022 or a drop in 2023, but rather that the price trends in their preferred locations have flipped.
The Number of Home Investors That Bought From Other Investors Reached Almost 19% in December
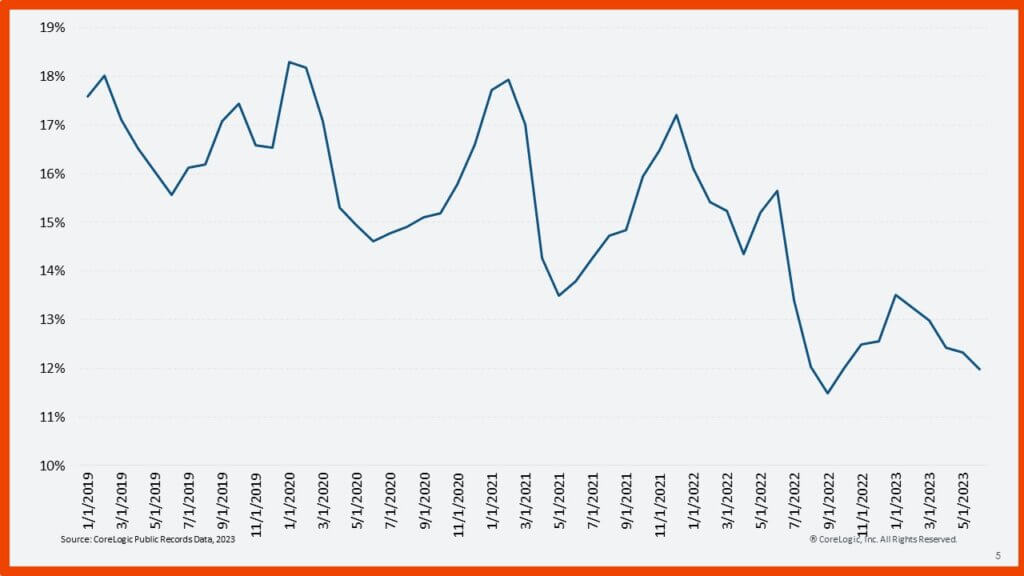
Investors are likely only making a small dent in homeownership numbers, with Figure 4 showing the share of investors that purchased properties from other investors. This number has ebbed and flowed from 16% to 19% over the past few years. Investors also make around 10% of their purchases on new homes and resell around 15% of their real estate portfolios. Given that investors buy around 900,000 homes per year, a loose calculation would put around 300,000 homes moving from owner-occupied to investor owners in a given year.
While 300,000 properties is a substantial number, it represents less than 0.5% of the total U.S. housing stock. So to see a notable decline in the homeownership rate, the increased investor activity would have to hold steady for a very long time, and that is not even accounting for additional factors. For example, the effect of home investor purchases could offset if some landlords also choose to sell homes to first-time homebuyers.

Home Flipper, iBuyer Activity Continue Downward Trends
Home-flipping activity continued to fall in the first half of 2023. Figure 5 shows the share of homes purchased by investors who resold properties within six months through June 2023. Only 12% of investors who purchased a home in March 2023 resold by the end of December 2023. The downward trend is clear in the data: about a 1 percentage point decline every year. This is not surprising, as flipping is a relatively less attractive business model than renting out a home when appreciation is slow and interest rates are high.
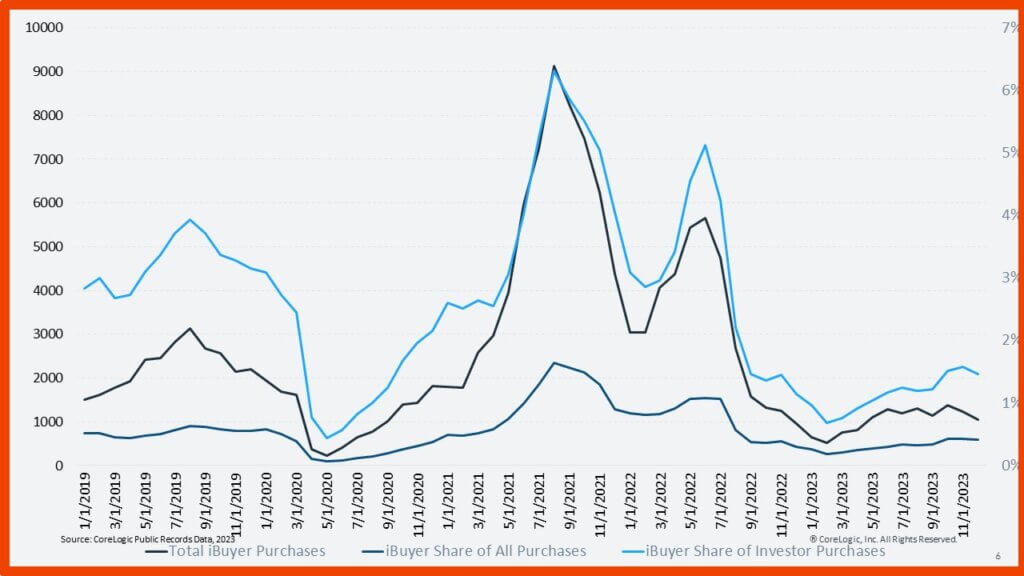
Nowhere is the decline of flipping clearer than in the purchasing habits of iBuyers. Figure 6 shows iBuyer market activity through December 2023. Throughout 2023, iBuyers accounted for less than 0.5% of all purchases and less than 2% of investor purchases. IBuyers purchased only around 1,000 homes per month in 2023. This is a huge decline from 2021 and 2022, when iBuyers were purchasing between 5,000 and 9,000 homes per month at certain points.
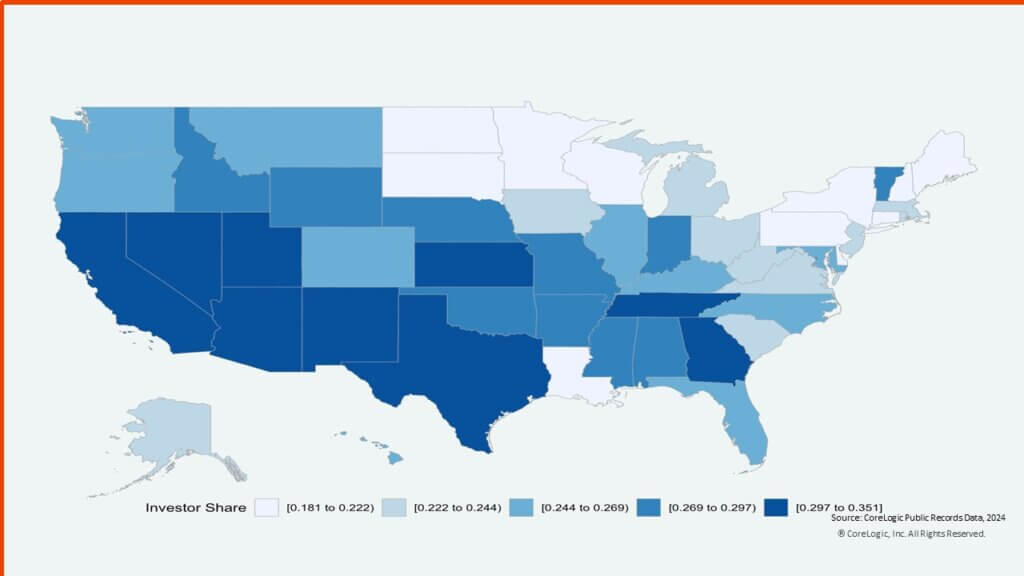
California Led the U.S. for Home Investor Share in 2023
Figure 7 shows home investor shares for 2023 by state. California (35%), Georgia (34%), New Mexico (33%), Kansas (32%), Texas (31%), Nevada (31%), Arizona (30%), Tennessee (30%) and Utah (30%) were the states with investor shares at 30% or higher.
However, that rate is relatively high across most of the country. Only Wisconsin, Louisiana, North Dakota, New Hampshire and South Dakota had investor shares below 20% last year. Given that home price trends have recently turned to favor the Upper Midwest and the Northeast, this explains why investor activity was negatively correlated with price gains for the first time in several years.
The investor share seems poised to remain high throughout the first half of 2024, but the question remains: What will happen if the expected mortgage rate declines in the second half of 2024 come to pass? This may well bring buyers back off the sidelines, leading to a drop in the home investor share. This is possible, since stocks are surging and real estate is not the hottest asset like it was in 2021, amid annual appreciation rates of more than 25% in many markets.
CoreLogic’s Office of the Chief Economist offers the latest data, insights and commentary on U.S. housing market trends, which are updated frequently and available here.
©2024 CoreLogic, Inc. All rights reserved. The CoreLogic content and information in this blog post may not be reproduced or used in any form without express accreditation to CoreLogic as the source of the content. While all of the content and information in this blog post is believed to be accurate, the content and information is provided “as is” with no guarantee, representation, or warranty, express or implied, of any kind including but not limited to as to the merchantability, non-infringement of intellectual property rights, completeness, accuracy, applicability, or fitness, in connection with the content or information or the products referenced and assumes no responsibility or liability whatsoever for the content or information or the products referenced or any reliance thereon. CoreLogic® and the CoreLogic logo are the trademarks of CoreLogic, Inc. or its affiliates or subsidiaries. Other trade names or trademarks referenced are the property of their respective owners.
[1] CoreLogic’s investor data goes back to 2010
[2] Using CoreLogic’s public-records data, an investor is defined as an entity (individual or corporate) that has retained three or more properties simultaneously within the past 10 years.
[3] Non-investors are those who do not meet the CoreLogic definition for an investor (see footnote 1). Only arm-length purchases are considered.


