Yanling Mayer contributed to this analysis.
Consumer confidence has risen to its highest levels yet since the onset of the pandemic. And while many consumers are planning to buy homes, cars and major appliances in the coming months, there are still about 2 million homeowners behind on their mortgage payments and/or in forbearance programs.
Nevertheless, as COVID-19-related economic restrictions lessen and federal- and state-level protections expire, so will the forbearance programs. Fortunately, the Consumer Financial Protection Bureau (CFPB) proposed a set of rule changes intended to help prevent avoidable foreclosures as the emergency federal foreclosure protections expire. Additionally, the Federal Housing Finance Agency (FHFA) will allow borrowers with mortgages backed by Fannie Mae and Freddie Mac to reduce their interest rates. And, most importantly, an abundance of home equity gives households a safety net to avoid losing their home to a foreclosure.
As discussed in our previous analyses, a typical homeowner in a forbearance has sizeable equity in their home, with median equity at more than $100,000 and median loan-to-value ratio at about 61%. But while tenure in the property and down payment play a role in accumulated equity, so does the geographic location as home prices and home price growth vary across the country. The analysis below examines home equity of households in forbearance programs by state.
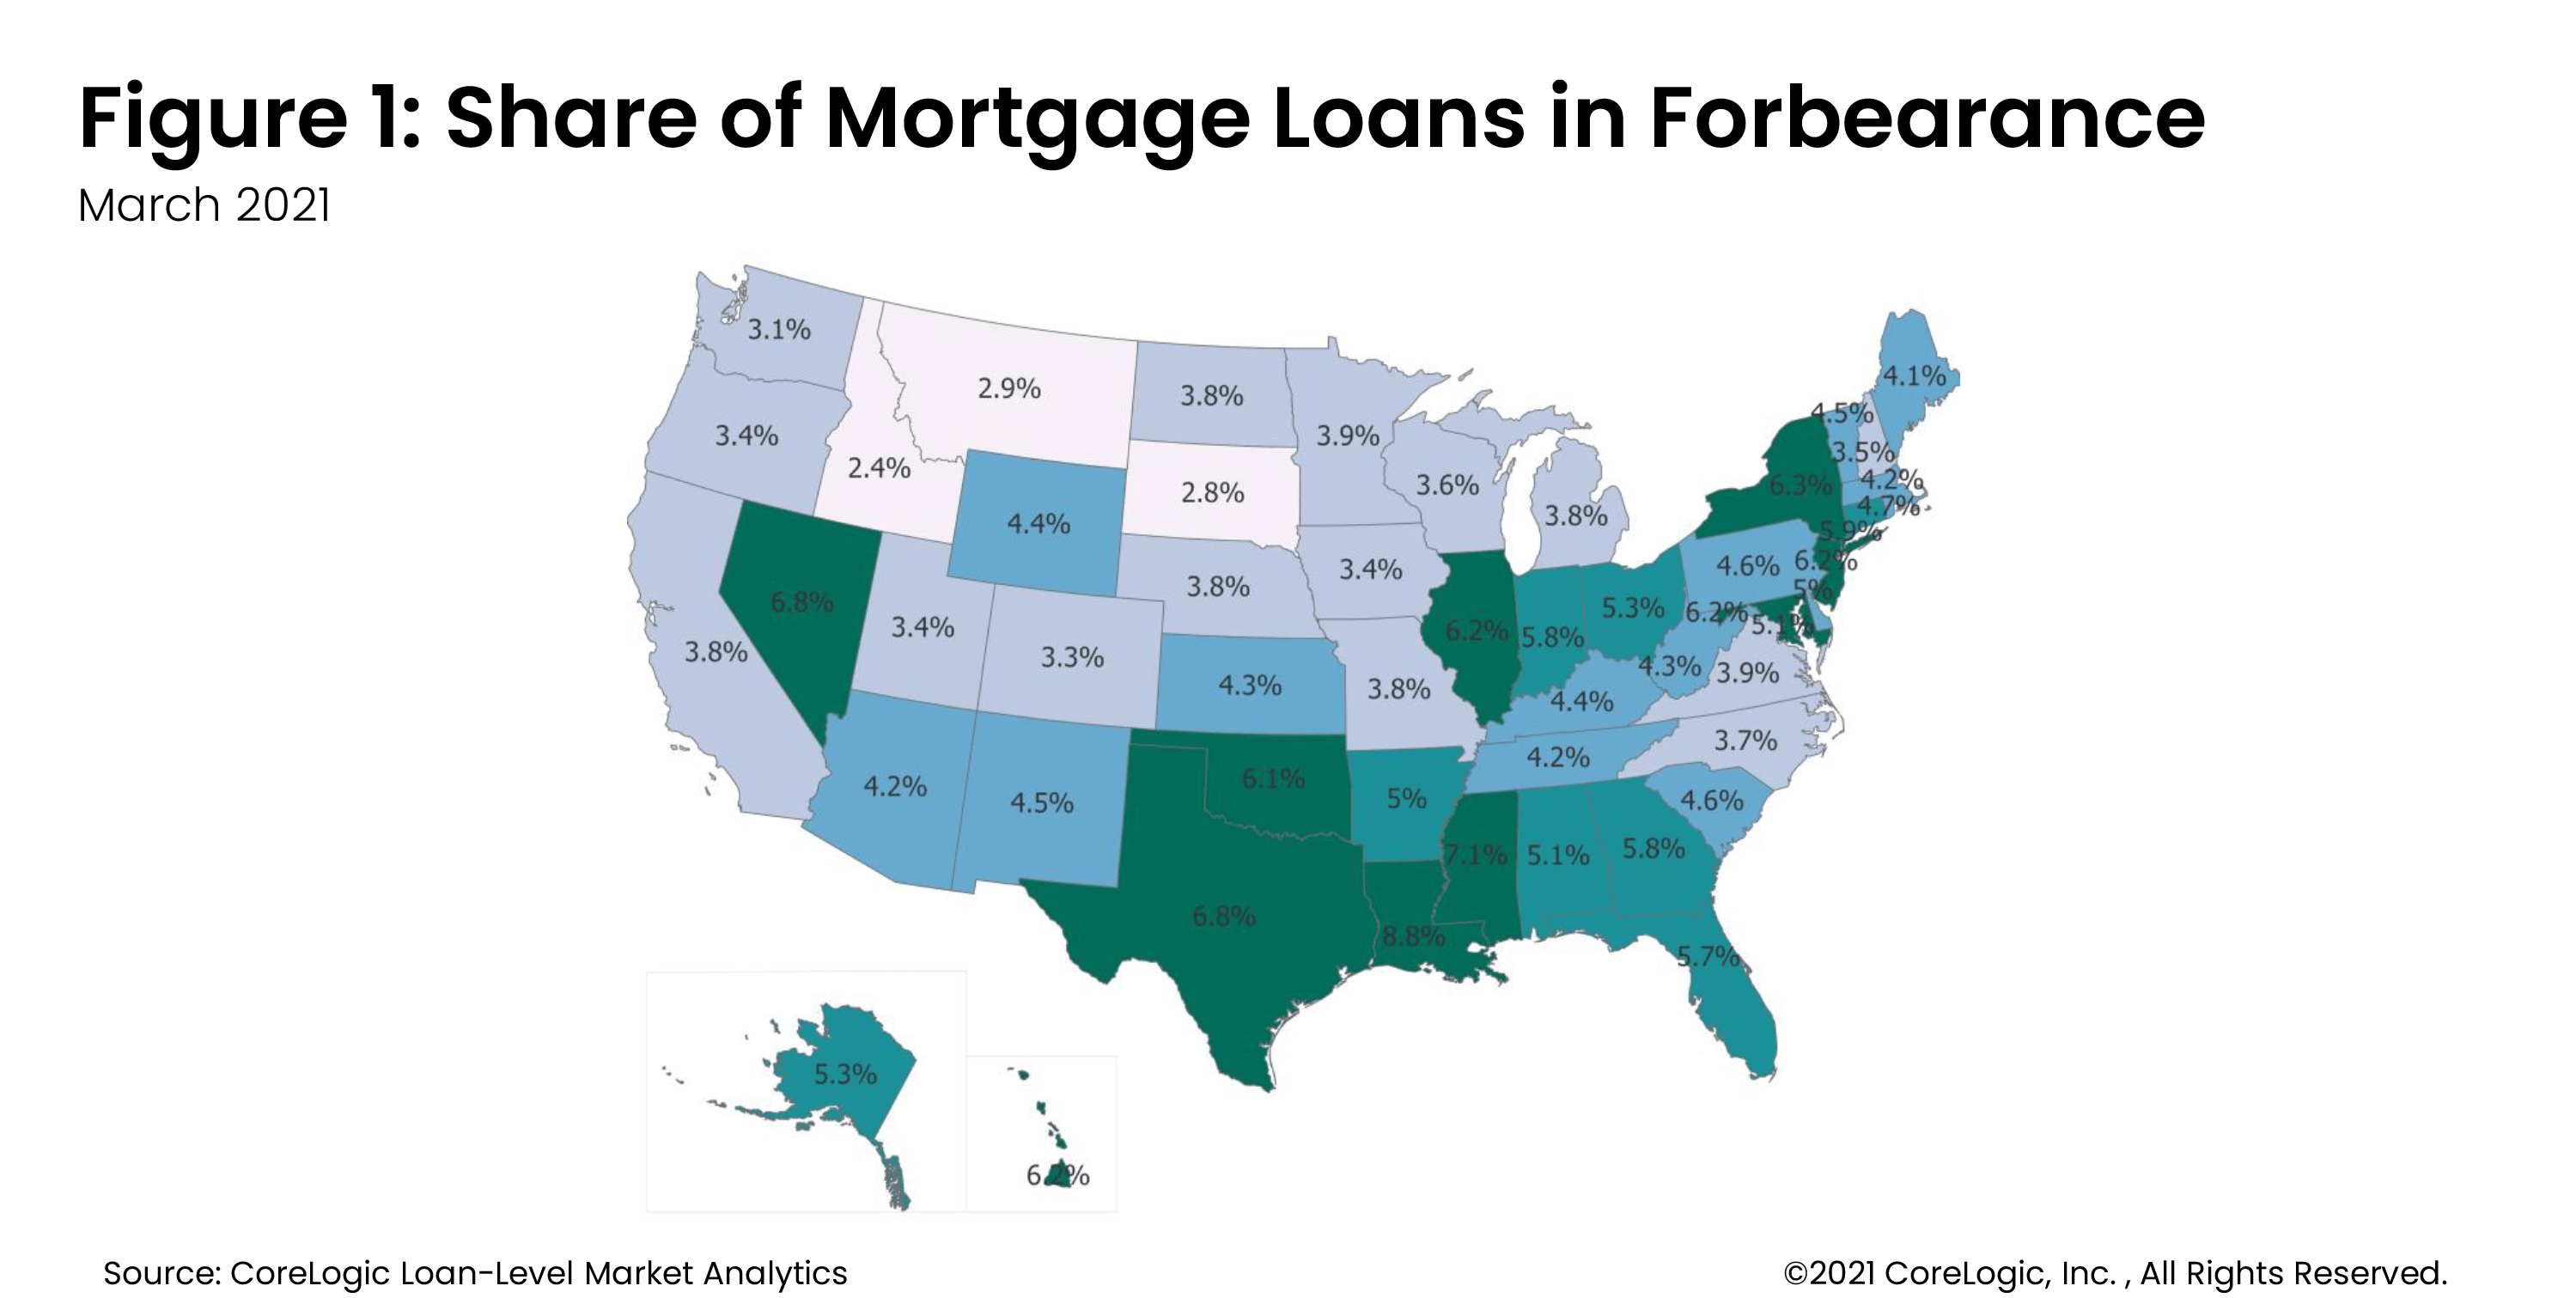
Figure 1 illustrates the share of households with a mortgage that were in a forbearance in March 2021. The states with the highest share of forbearances remain those that were especially impacted by the COVID-19 pandemic, such as Nevada and New York, as well as states that suffered significant damage from hurricanes that swept the coastal Gulf region last summer as well as loss of jobs in oil and gas extraction, such as Texas, Louisiana and Mississippi. According to the latest CoreLogic Loan Performance Insights, the metro areas with highest annual increase in serious delinquencies in April 2021 were Odessa, Texas; Midland, Texas; Lake Charles, Louisiana and Laredo, Texas.

Unfortunately, households in the states with elevated forbearance rates also had relatively lower equity accumulation. For example, a typical borrower in forbearance in Louisiana, where the forbearance rate is the highest, has about $49,000 in equity. Meanwhile, a borrower in a similar predicament in Idaho, where the forbearance rate is the lowest, typically has $156,000 in equity. Idaho has seen the largest gain in equity among all homeowners, up about $71,000 year-over-year between the first quarter of 2020 and 2021 as the state saw significant gains in housing demand and home price growth.
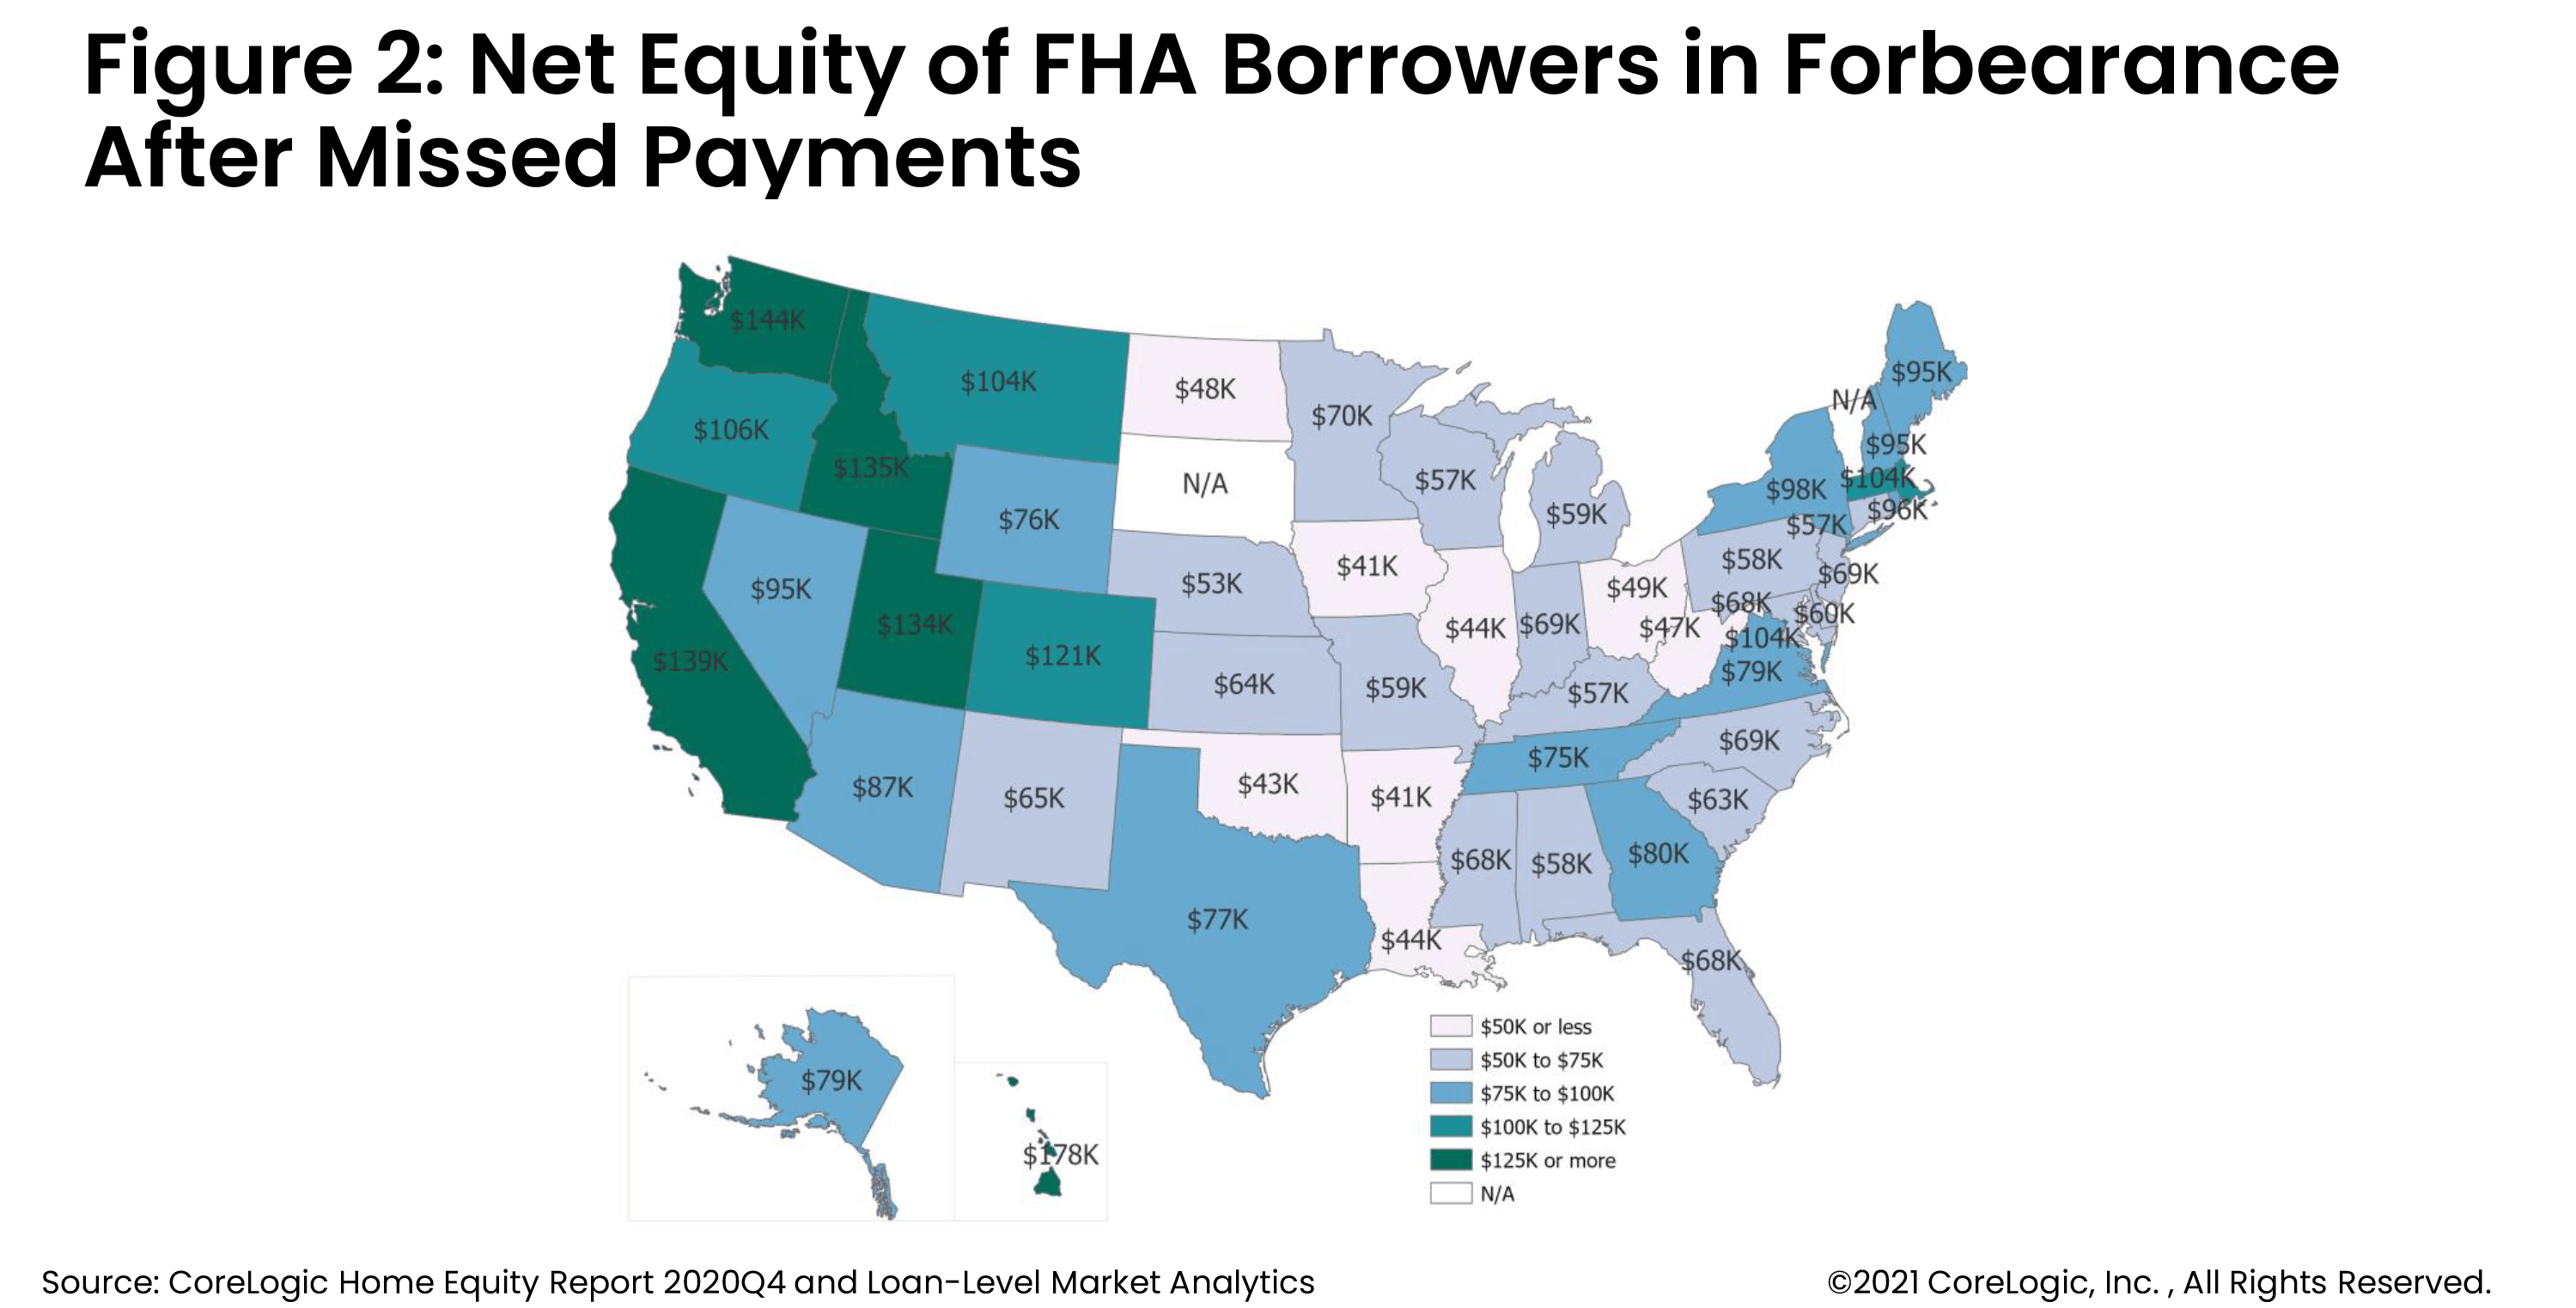
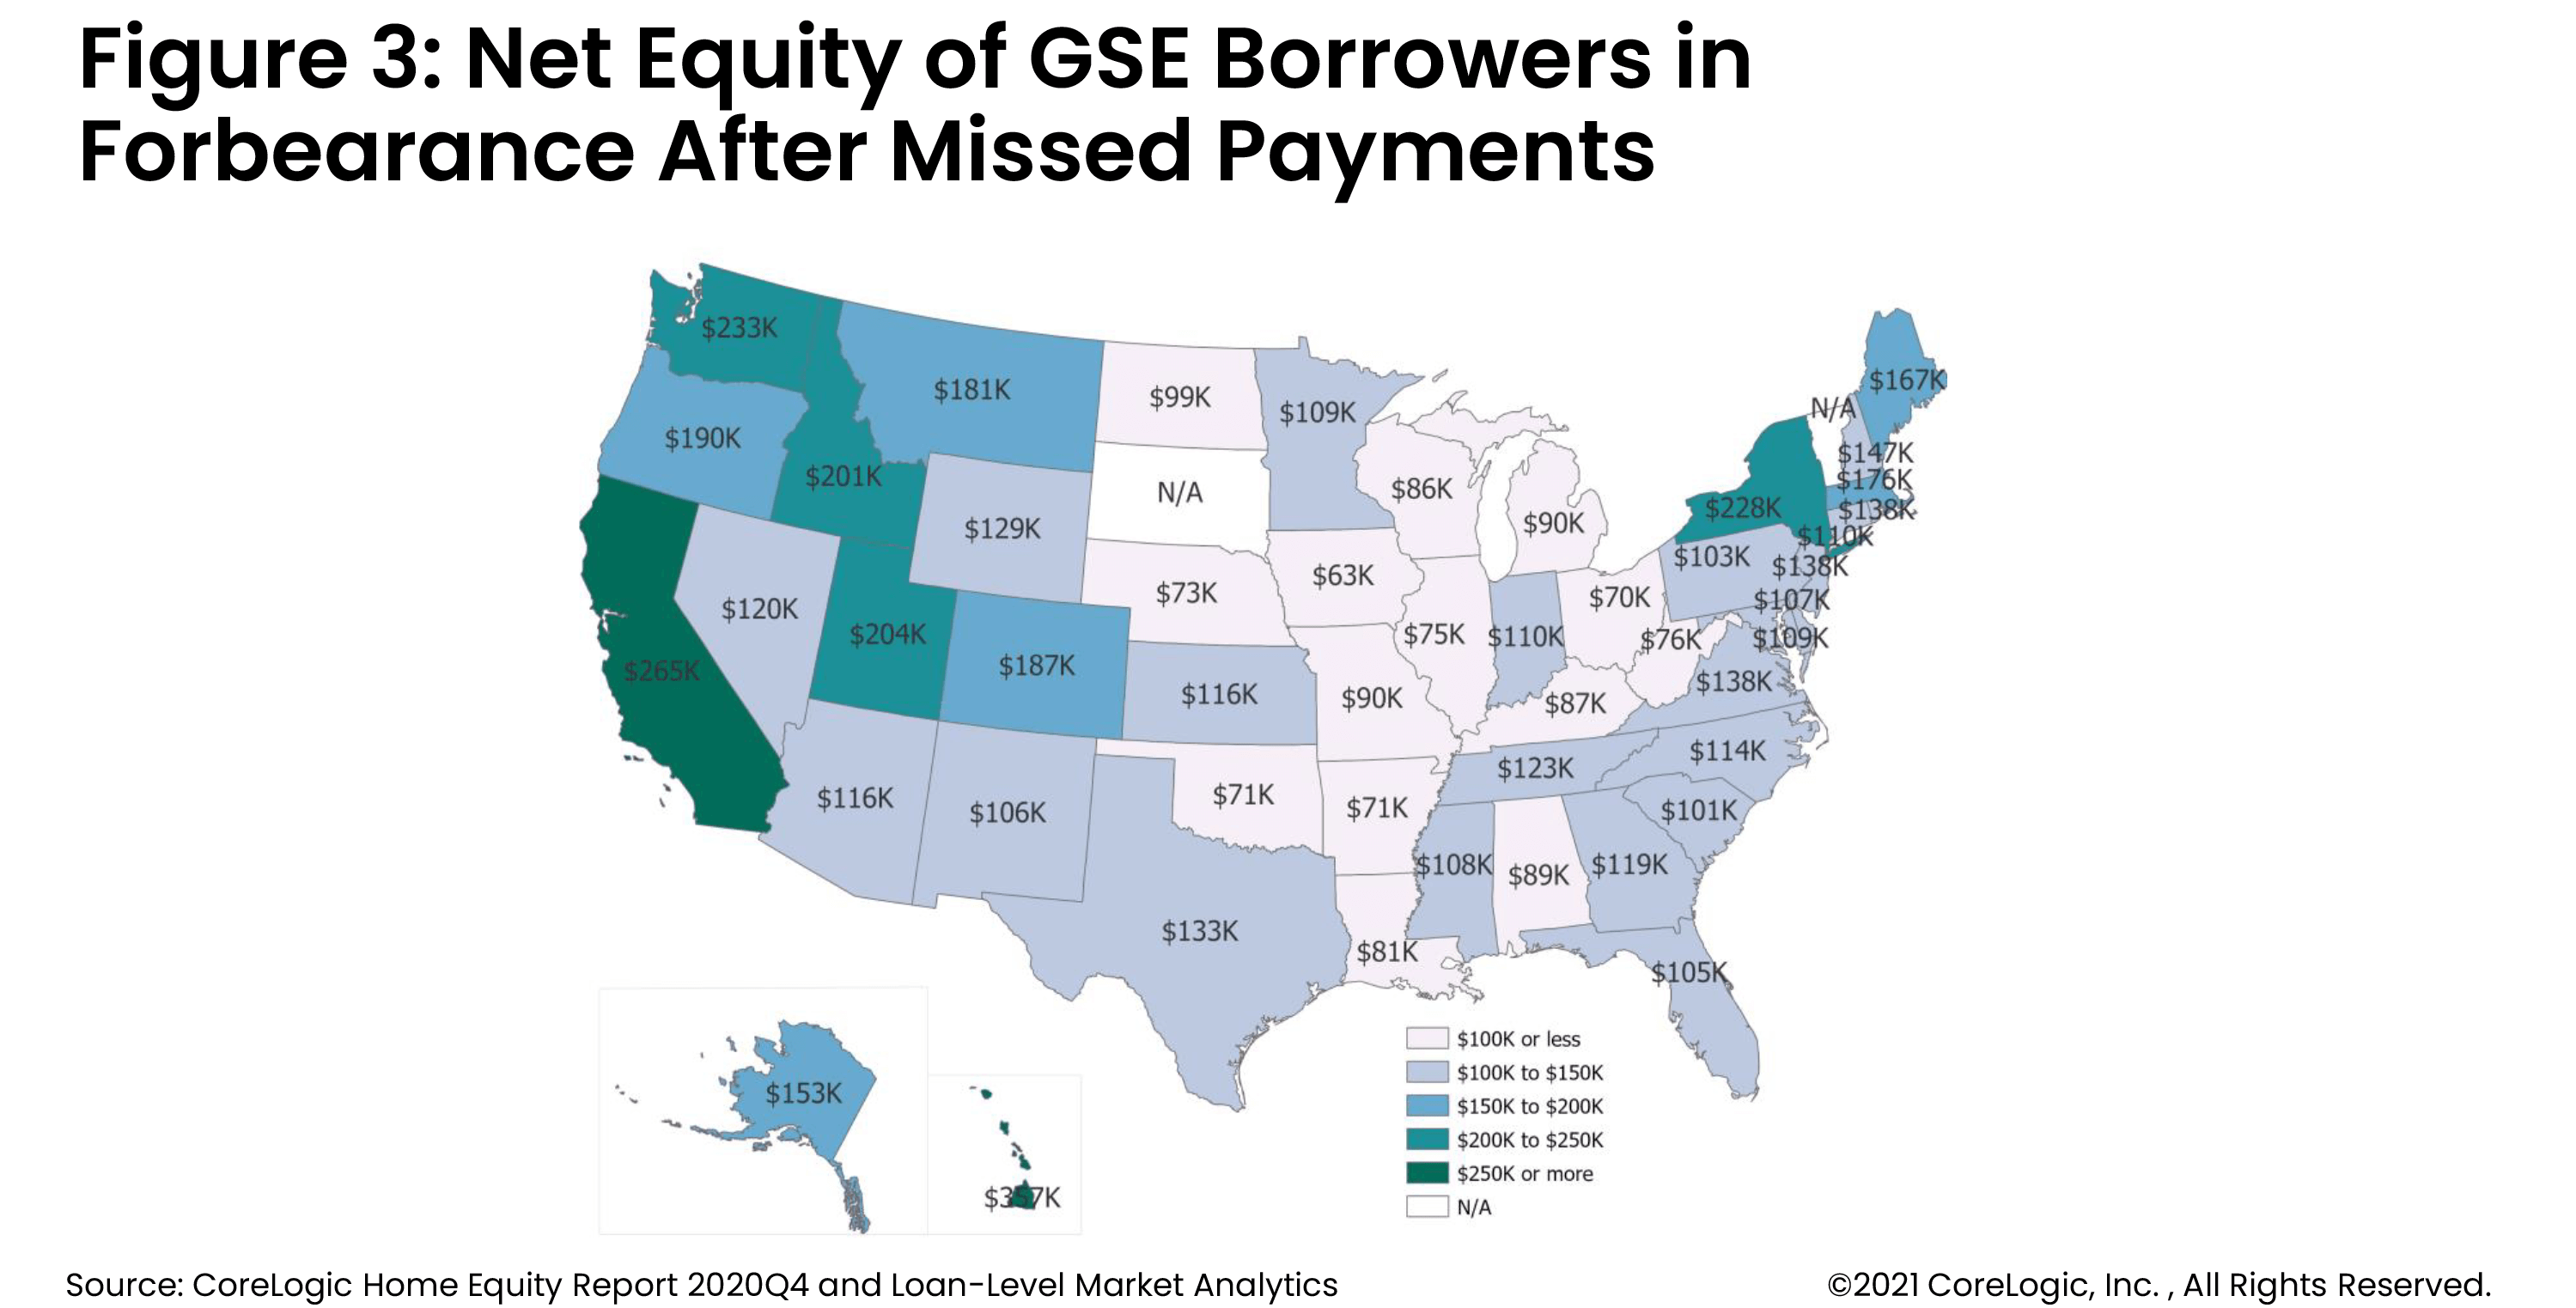
Nevertheless, borrowers in forbearance programs in disproportionally affected states like Louisiana still have a substantial amount of equity even after accounting for missed payments. Figure 2 and Figure 3 map out the equity of households in forbearance for which missed payments have been accounted.
Figure 2 summarizes the equity gains for those with Federal Housing Administration (FHA) loans who generally have smaller levels of equity compared to government-sponsored enterprise, or GSE, borrowers given the lower down payment requirements and likely lower home purchase prices. Following Arkansas at $41,000, the other states with less than $50,000 include Iowa, Oklahoma, Illinois, Louisiana, West Virginia, North Dakota, and Ohio. In contrast, following the top-ranking Hawaii at $178,000 are California, Idaho and Utah, all with around $135,000 in equity among FHA borrowers in forbearance.

Figure 3 summarizes equity gains after missed payments for those in forbearance with GSE loans. As previously noted, net equity is notably larger among GSE borrowers as they have likely provided larger down payments and have bought higher priced homes. Nationally, a typical FHA borrower in a forbearance has about $68,000 in equity while a GSE borrower has about $125,000 in equity.
By state, the equity of GSE borrowers in a forbearance ranges from $63,000 in Iowa to $357,000 in Hawaii. But, while Hawaii’s homeowners do enjoy the highest levels of equity, their forbearance rate remains elevated at 6.2%, and the Kahului-Wailuku-Lahaina metro area continues to clock a high rate of serious delinquencies (6.5% in April 2021, up 5.1 percent points year-over-year). This suggests that while there are more borrowers at risk of losing their homes, they are able to tap into their equity and opt for a resolution other than a foreclosure.
Nevertheless, even among states with a fifth of the accumulated equity of Hawaii – such as Illinois where the typical GSE borrower’s equity averages $75,000 after missed payments and the forbearance rate is similar to Hawaii’s at 6.2% – the borrowers still have abundance of equity to safeguard them from a foreclosure.

In a nutshell, despite the economic and emotional burden brought on by the pandemic, most borrowers across the country do have sufficient equity buffers to stave off a potential foreclosure. Fortunately, the CFPB and the FHFA have continued to take additional steps aimed at preventing a foreclosure crisis. As a result, a wave of foreclosures is highly unlikely, particularly of the magnitude seen during and immediately after the Great Recession.
Nevertheless, there remain pockets of forbearance loans that are in or near negative equity which could lead to some heightened risk of a blip in distressed sales after forbearance ends. We will explore those in a follow-up analysis coming soon.
©2021 CoreLogic, Inc., All rights reserved.


