Monthly price gains among high tier homes experience relatively larger slowing compared to low tier
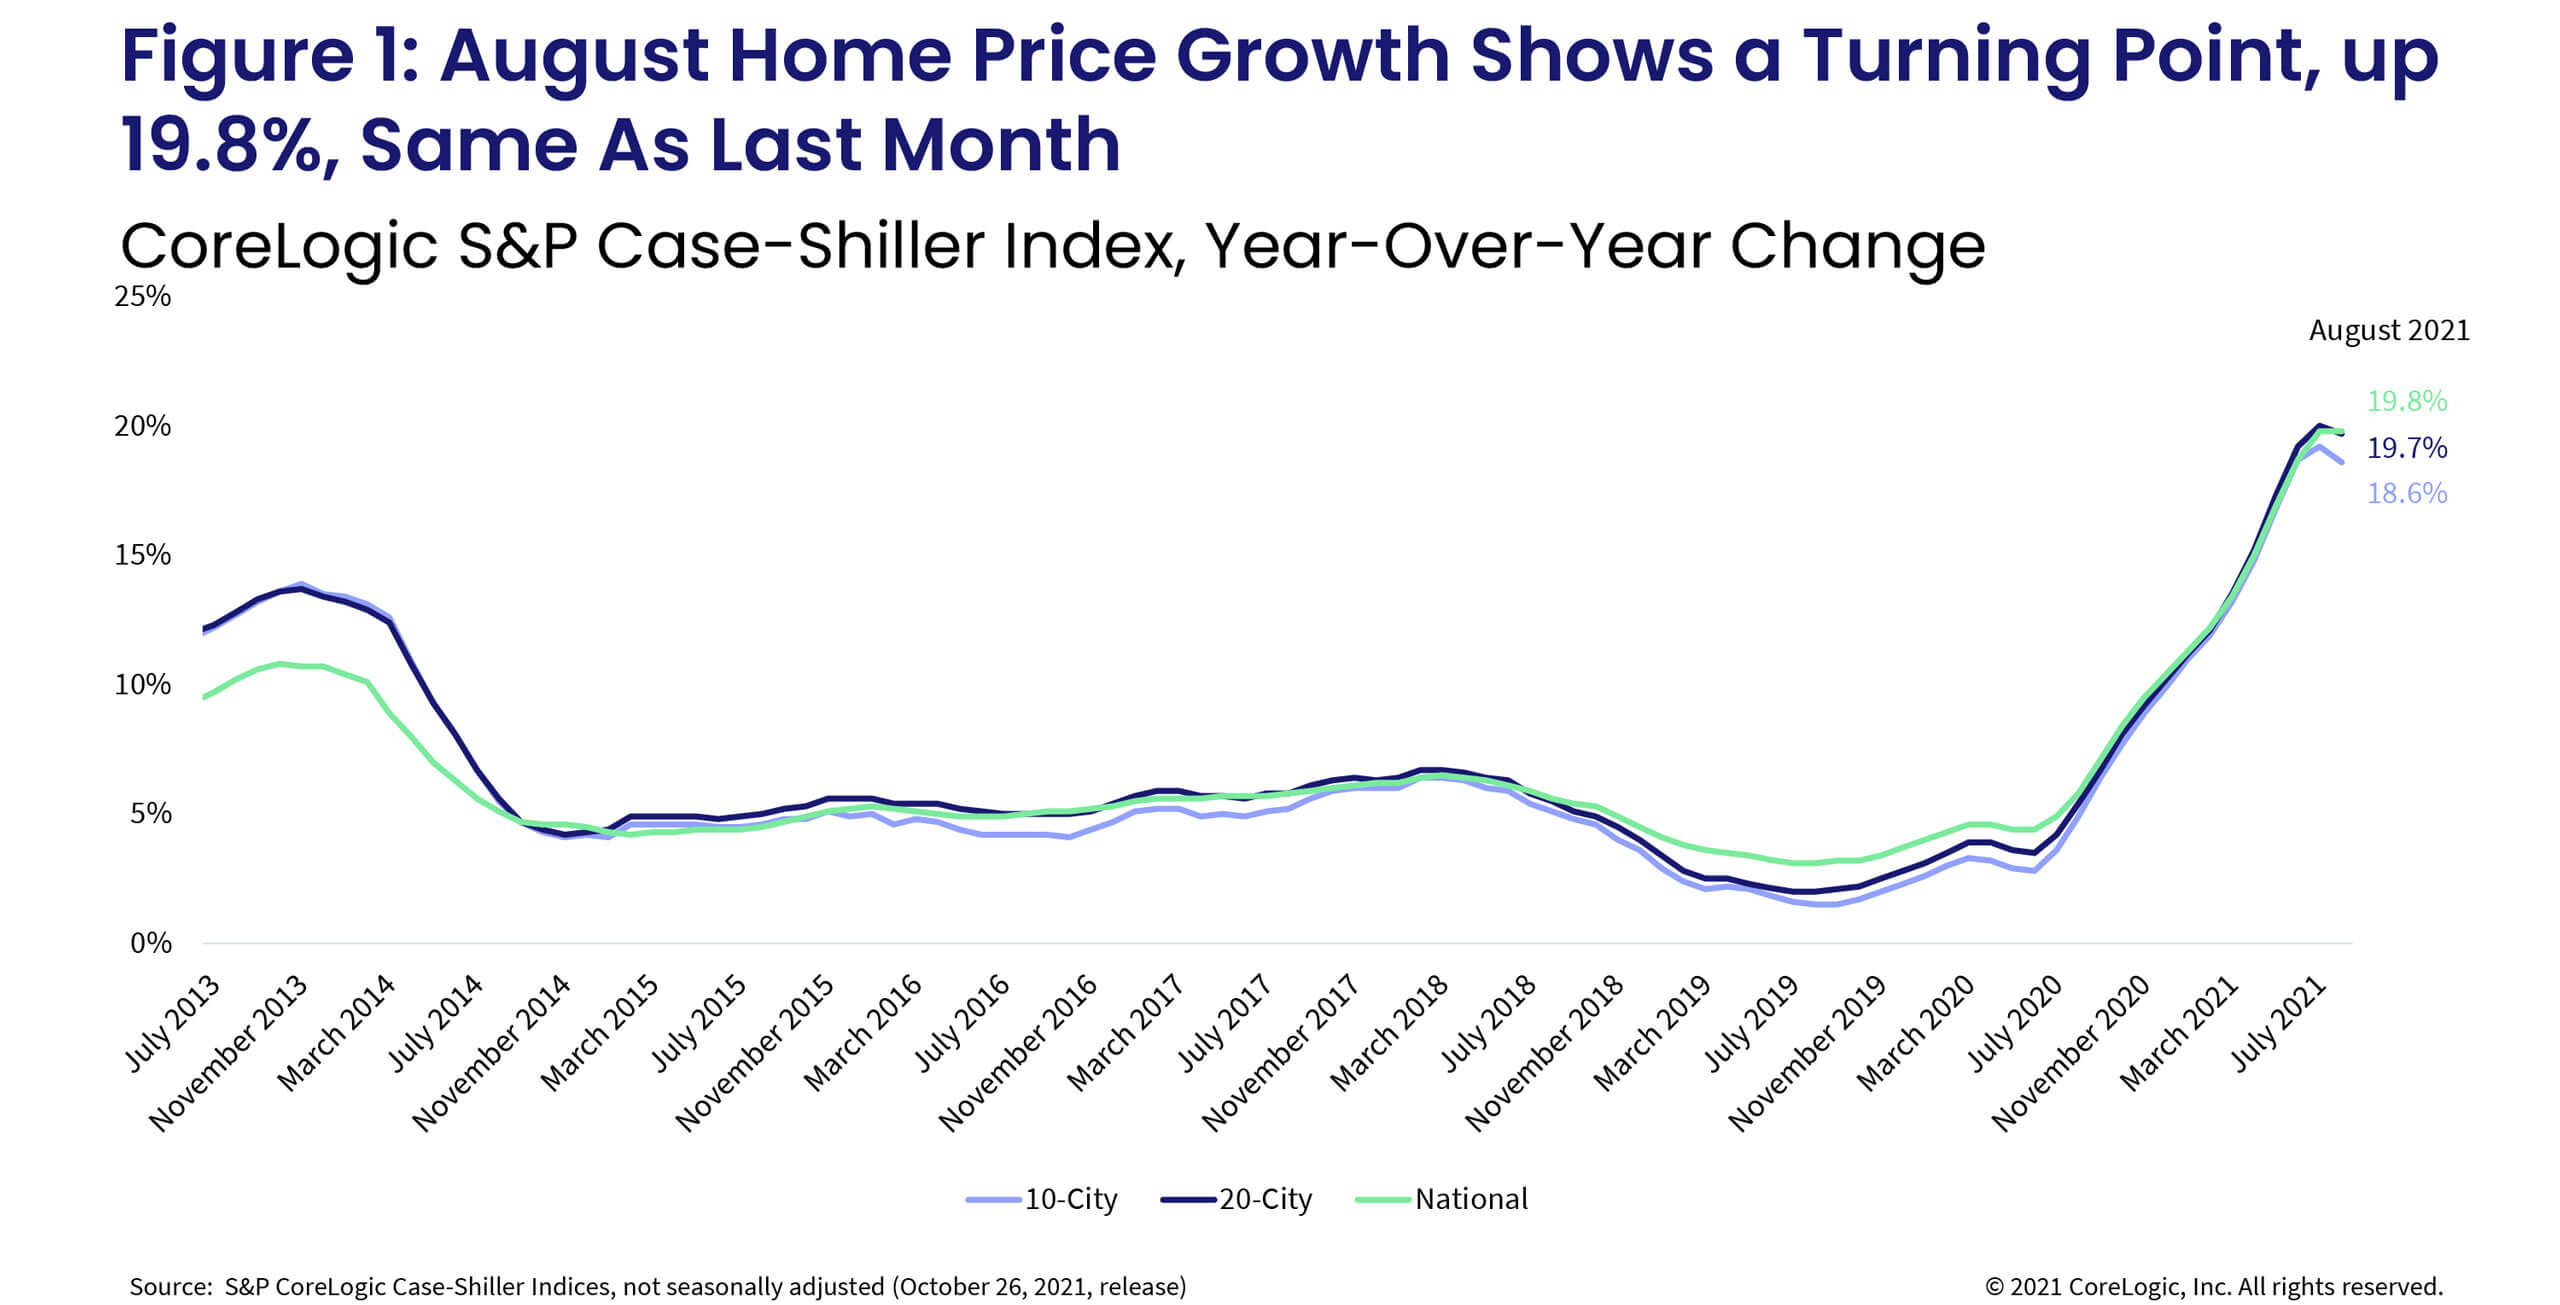
Persistently strong demand among traditional buyers has been amplified by an increase in demand from investors this summer, keeping the latest S&P CoreLogic Case-Shiller stalled at the previous month’s peak increase: up 19.8% year over year. However, the continued increase in the month-to-month index, up 1.19%, showed the fastest July-to-August rate since the 1970s.
Despite the expected seasonal, summer-end slowing of homebuying activity, demand for homes remained robust. Pending sales indicators also suggest fall activity is likely to outpace last year’s levels when the surge in homebuying activity took hold. As a result, 2021 is going to be the strongest year for home sales since 2006.
Demand pressures have continued to keep the pressure on the home price growth higher despite some signs of buyer fatigue and slight improvements in the availability of for-sale homes. Nevertheless, most of the market competition indicators suggest that even with some buyers discouraged or priced out of the market, competition for homes remains high. For example, over half (52%) of the available for-sale homes on the market still sold over the asking price in August, a slight decline from the 58% peak in June. Prior to the pandemic, about 25% of homes were selling over the asking price during the peak month of June.
Nevertheless, while concerningly strong home price appreciation rates are narrowing the pool of buyers, particularly first-time buyers, the depth of the supply and demand imbalance, and robust demand among higher income earners, has kept upward pressure on prices.
The 10- and 20-city composite indexes slowed slightly in August, up 18.6% and 19.7% year over year, respectively. In July, the indexes recorded gains of 19.2% and 20%, respectively (Figure 1). Interestingly, the 20-city index’s faster acceleration reflects the rapid price growth seen in smaller, more affordable metros where in-migration from coastal residents has been pushing home price growth to new highs. Compared to the 2006 peak, the 10-city composite is now 27% higher, while the 20-city composite is 33% higher.

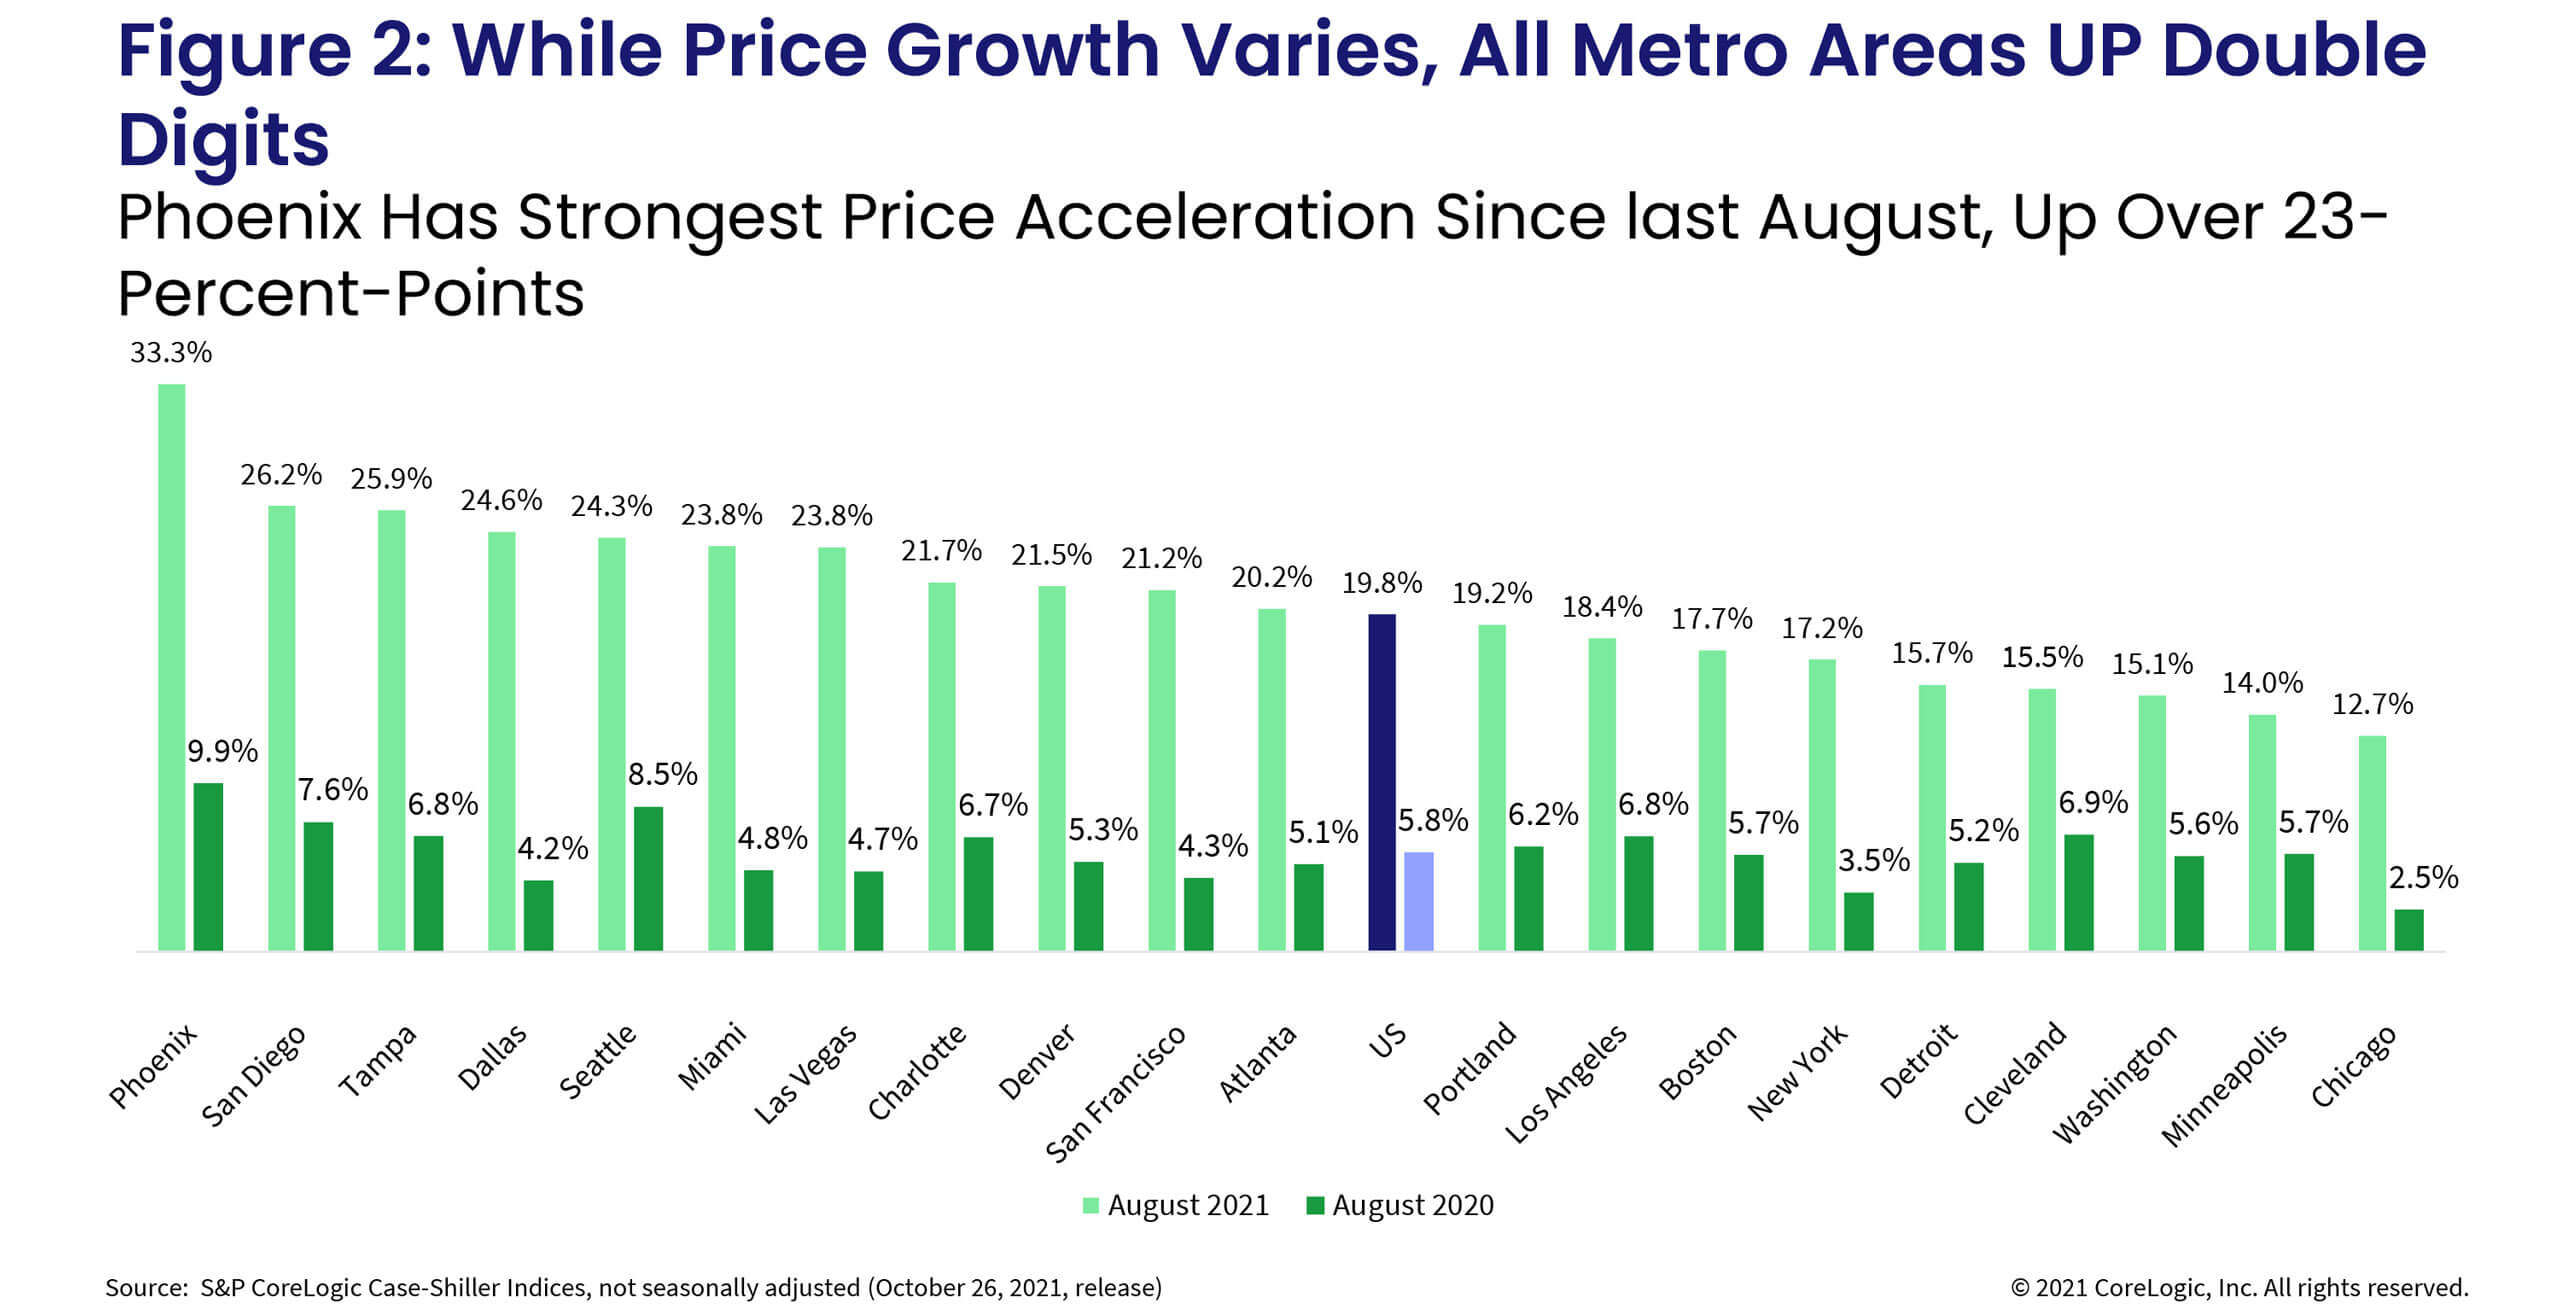
For the 26th consecutive month, Phoenix has had the strongest home price growth among the 20 markets, surging 33.3% in August. The city’s price growth is now 7-percentage points faster than the second-fastest growing city, San Diego. And while this is the fastest acceleration since the spring of 2006, during the pre-Great Recession housing price surge, Phoenix home prices grew as much as 49%.
There has been some change in the ranking of metropolitan areas by price growth over the last year. San Diego remained in second place, with an annual acceleration of 26.2%. Tampa, Florida, now replacing Seattle in third place, had a 25.9% jump in August.
Chicago and Minneapolis continued to lag, up 12.7% and 14%, respectively. Though both cities are experiencing double-digit price growth, the growth rate has slowed some in August (Figure 2).

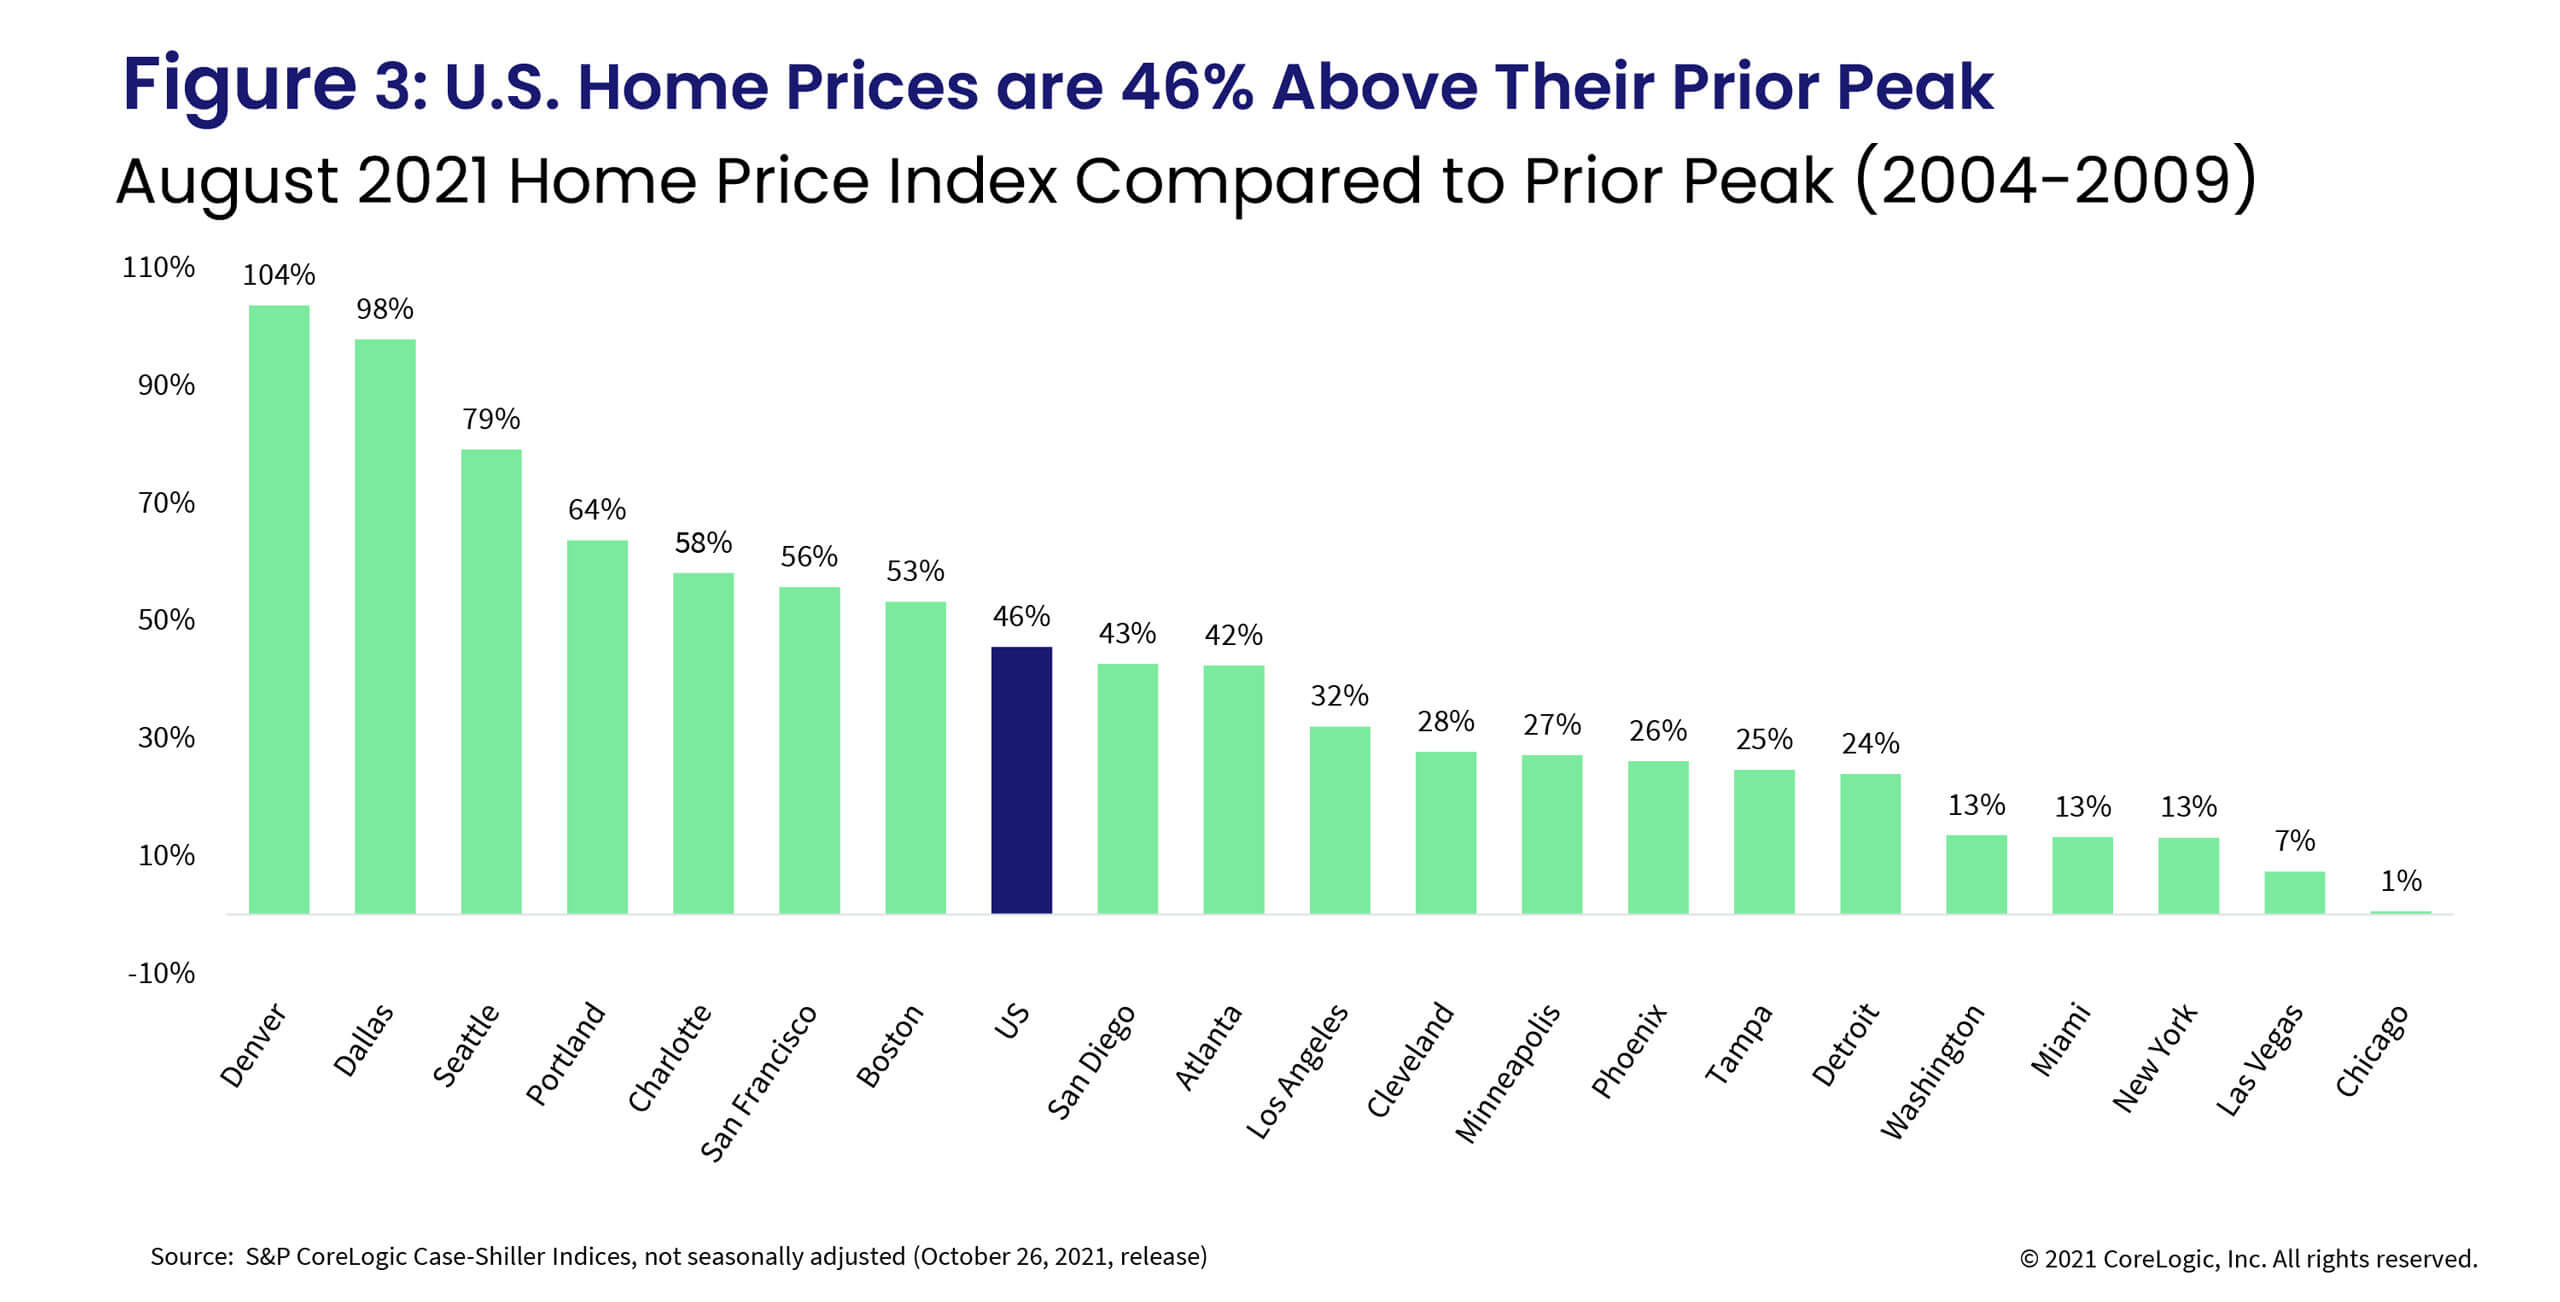
In August, national home prices were 46% higher than the previous peak. All metros are now at or above their previous peaks. Chicago has finally caught up with its previous peak, up 1%, while Denver’s prices have leapt 104% above its 2006 peak, followed by Dallas at 98% (Figure 3). Nonetheless, while nominal prices have surpassed previous levels, national home prices are only 11% above the previous peak when adjusted for inflation.

Further, while low and high tier home price growth remain very close to each other, both also experienced slight declines in August compared to the month before, up 21.1% and 21%, respectively. The middle tier, however, logged a somewhat smaller, 20.3% year-over-year increase, also slower than the previous month. Prior to the pandemic, low tier price growth was generally accelerating at a faster rate than the high tier. It will be interesting to see the change in high tier price growth in the coming months.
In addition, the month-to-month comparison of home price growth by price tier and location reveal a recent relative desirability of metro areas and purchase power of the buyers.
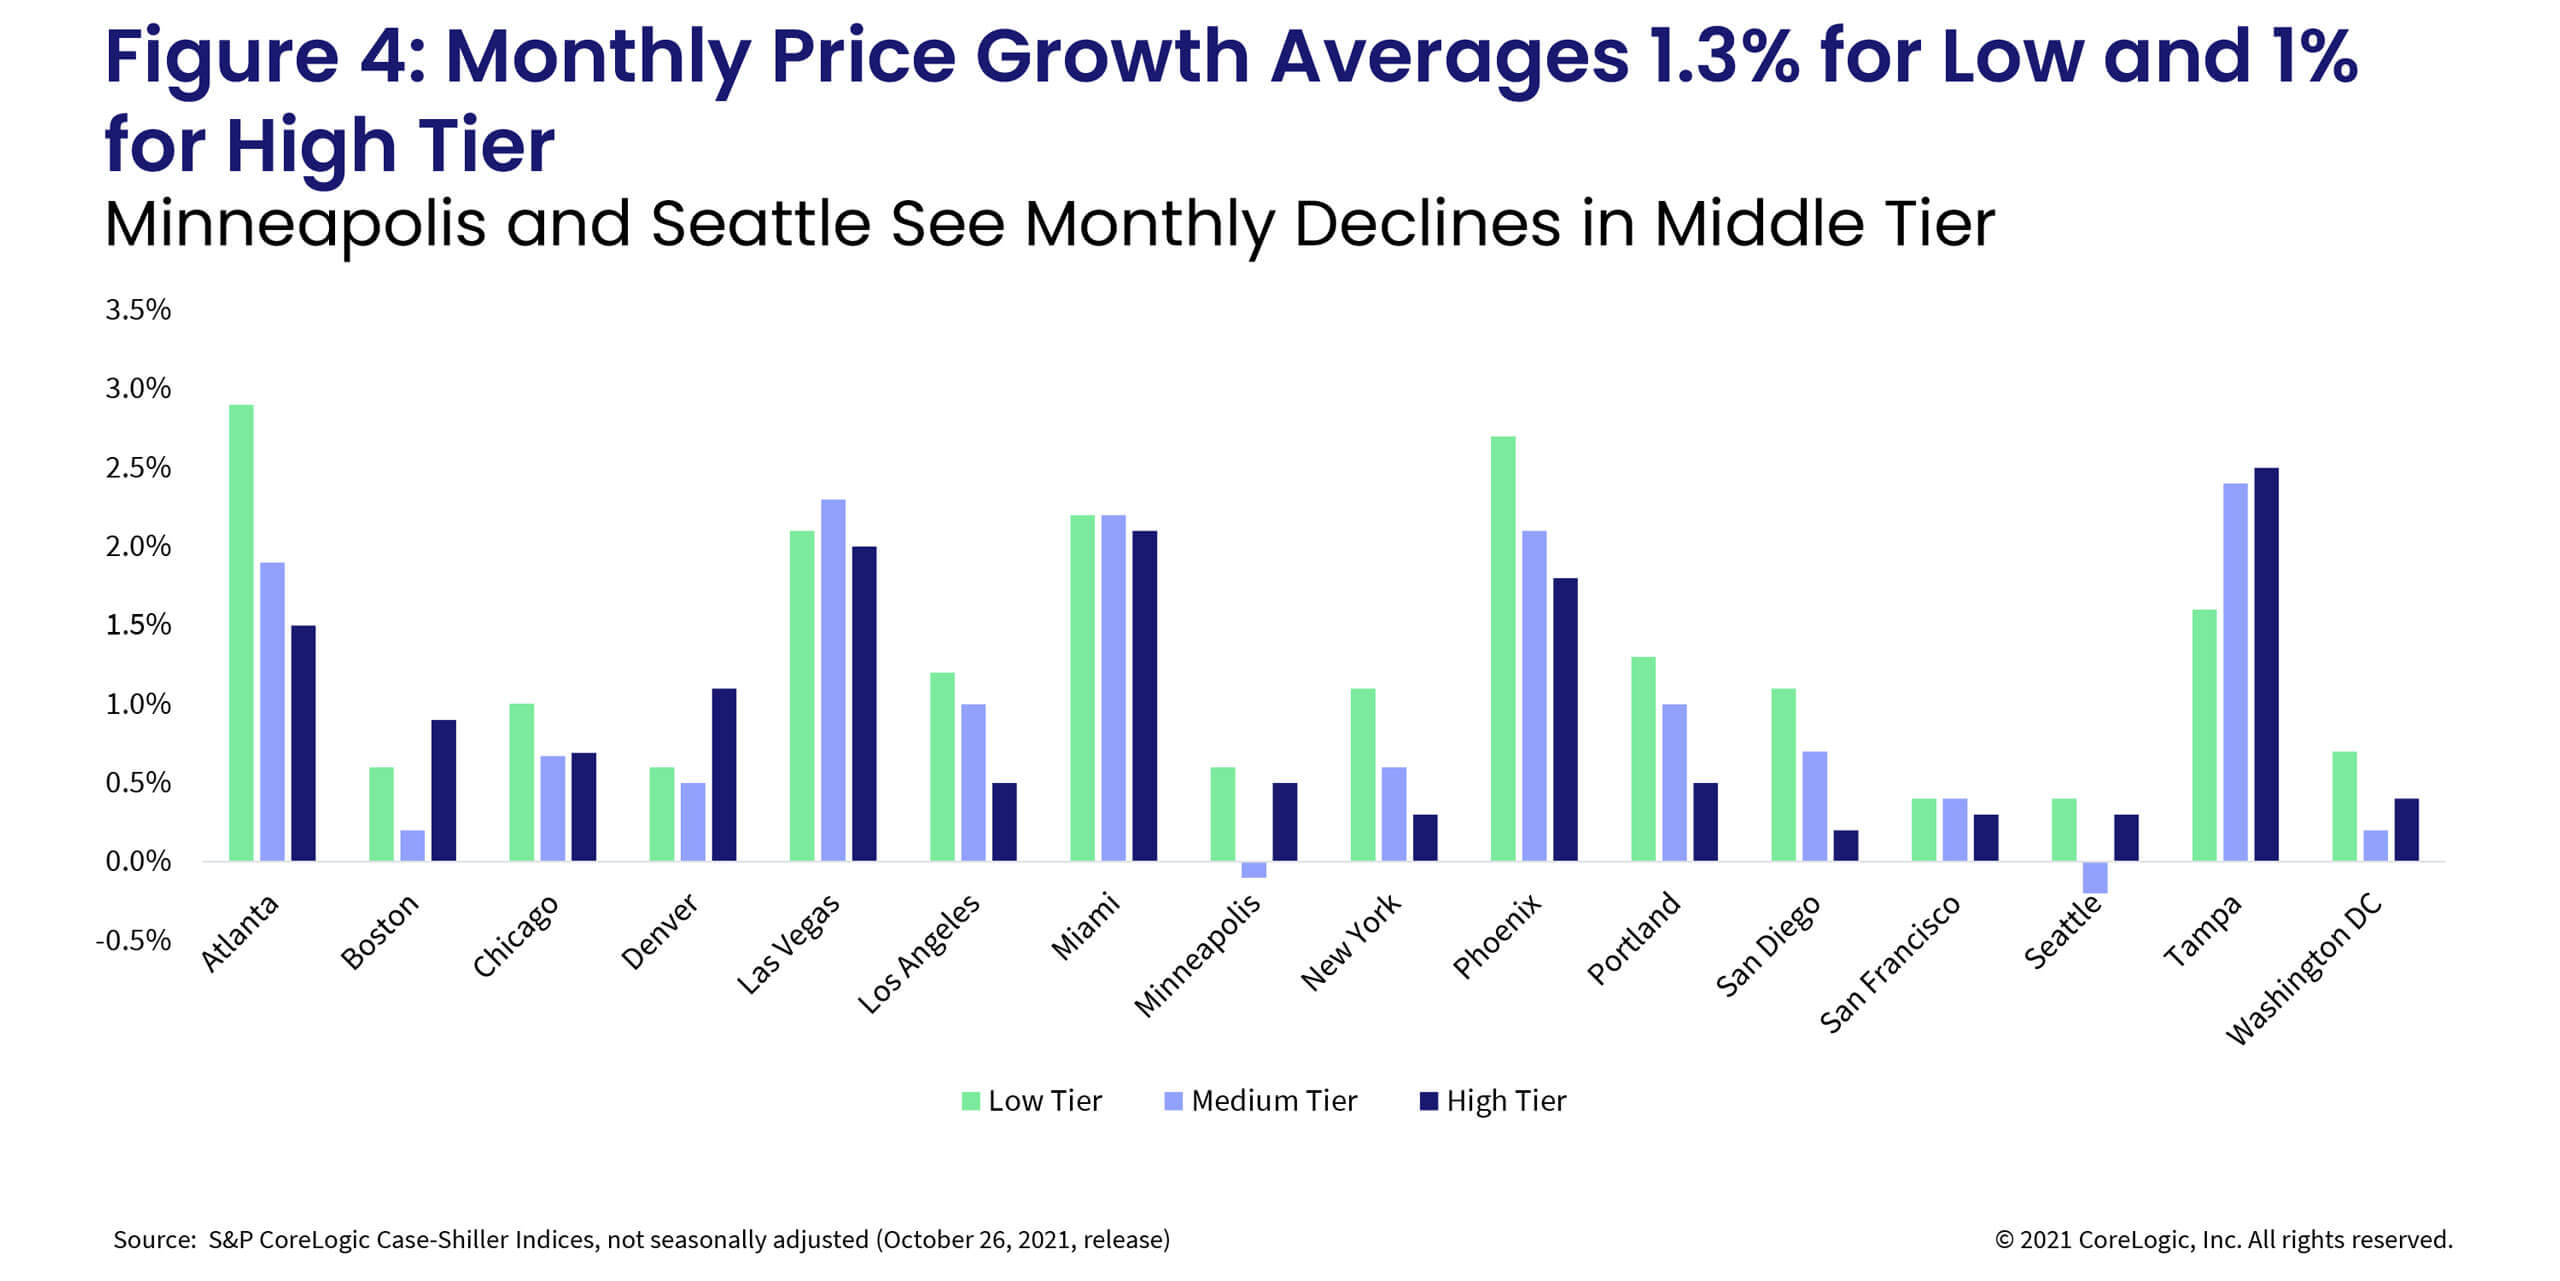
From July to August, the largest home price increase in the lower one-third price tier was in Atlanta, up 2.9%, followed by Phoenix, up 2.7%. The average monthly gains among low tier homes have slowed from 1.8% in July to 1.3% in August, though these are not seasonally adjusted.
In the high tier, Tampa led the monthly gains, up 2.5%, followed by Miami, up 2.1%, and Las Vegas, up 2%. Despite Phoenix leading the way in gains the previous month, it is now ranking in 4th place. San Diego had the largest deceleration in high tier price growth, up only 0.2% and down 1.7-percentage points from July. Average monthly gains in the high tier slowed more in August, up only 1% on average compared to July’s 1.7% monthly gain.
In the middle tier, some markets have experienced monthly declines. Minneapolis was down 0.1% while Seattle was down 0.2% in August (Figure 5).

In conclusion, while this summer marked the peak of home buying activity that hasn’t been seen since pre-Great Recession, demand for homes remains robust and is being augmented by elevated demand from investors. And although some of the buyer frenzy seems to have faded, home price appreciation is likely to reflect a continued deep imbalance between buyer demand and home supply, leading the rate of appreciation to remain close to the current highs going into the fall.
Nevertheless, while we are likely to see even more seasonal slowing in activity, home price growth may also to start to decelerate. There are already signs of more rapid slowing among the higher priced homes while demand in the low tier is still being bolstered by first-time buyers and the recent elevated influx of investor buyers. According to CoreLogic HPI forecast, home price growth next August will slow to 2.2% nationally.


