Home prices are down by 3% from June’s peak, with double-digit declines in San Francisco and Seattle
Housing markets continue to struggle with the loss of consumer confidence and the persistent standoff between buyers and sellers. The rapidly rising cost of homeownership and fears of price declines are holding back potential buyers, while prospective sellers are contending with the lock-in effect of notably lower mortgage rates than current ones, which financially disincentivizes them from moving. As a result, home price appreciation continues to slow at a rapid pace.
In September, the CoreLogic S&P Case-Shiller Index posted a 10.6% year-over-year increase, down from a 13% gain in August, marking the sixth straight month of decelerating annual home price appreciation. The swift decline in home price growth puts this September’s annual gain as the slowest since December 2020 (Figure 1).
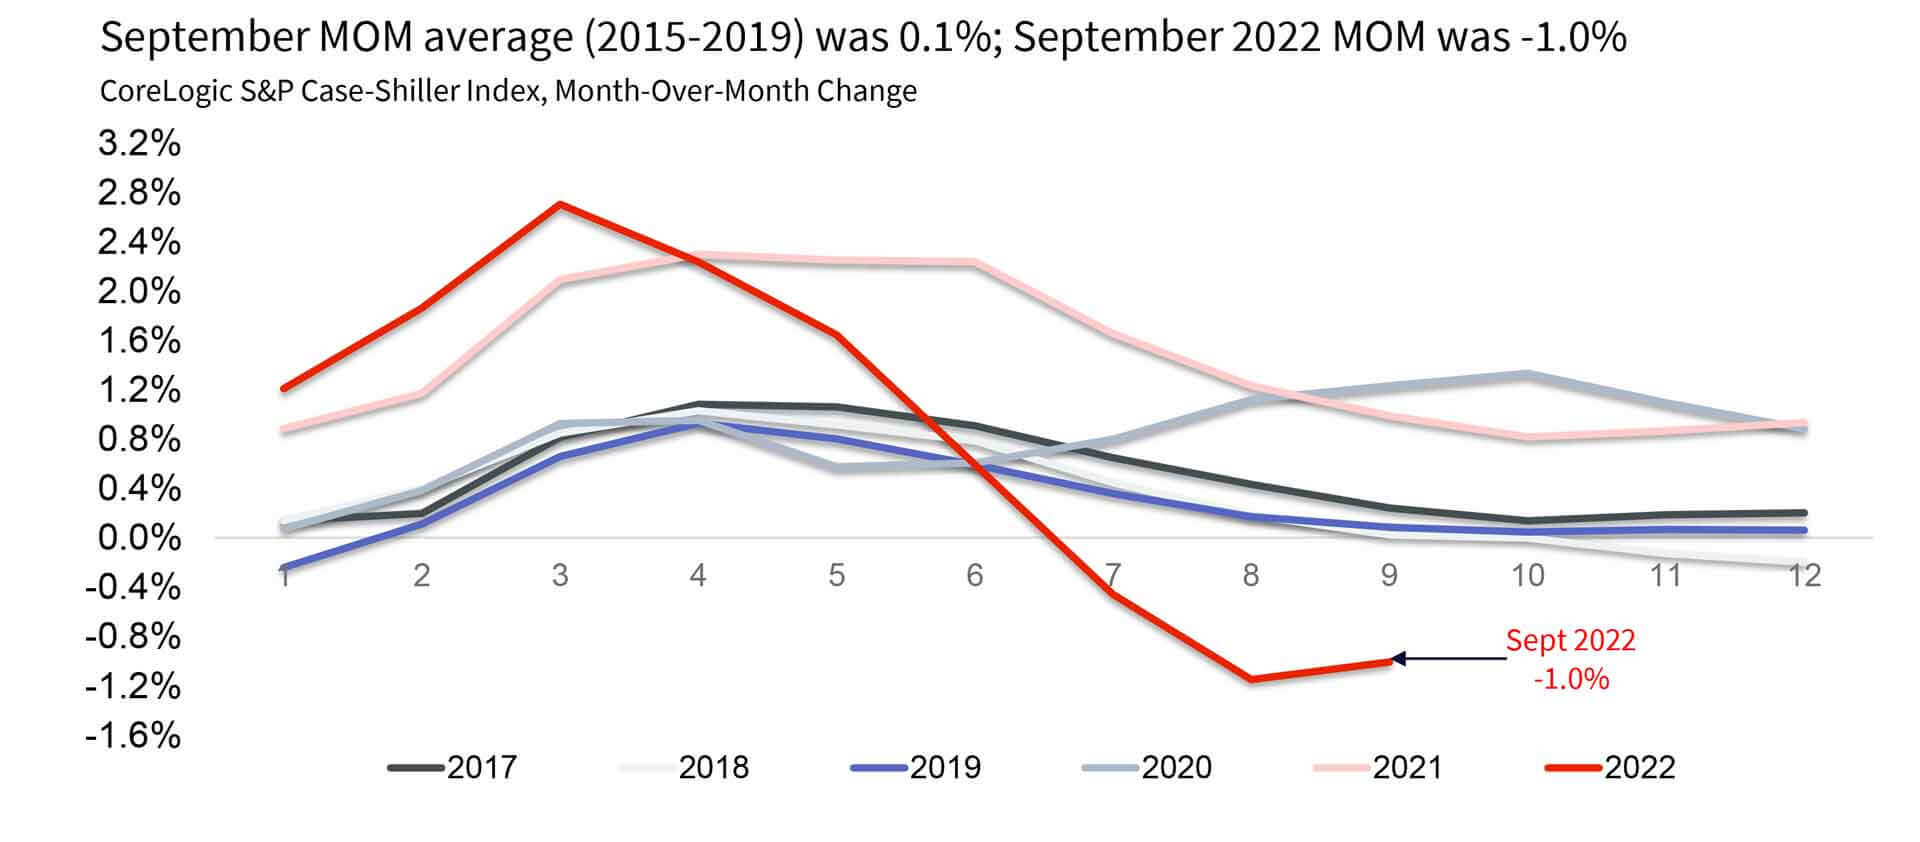
In addition, the non-seasonally adjusted month-to-month index posted its third month of declines, down by 1% in September from a 2.6% peak increase in March and a 1.15% decline in August. September’s slower monthly decline may reflect some improvements in mortgage rates in August that drew in homebuyers who jumped in following the June’s surge in rates. Between 2014 and 2019, the monthly index changes from August to September averaged about a 0.1% gain (Figure 2).
At this pace, and according CoreLogic’s Home Price Index forecast, annual growth is expected to slow to 8% by December and 0% by the spring of 2023. Some markets will see more notable price slowing and potential declines in 2023, though decreases are expected to remain regional and specific to metro areas that saw relatively more price growth during the pandemic, such as Las Vegas and Phoenix. Based on CoreLogic’s September HPI, San Francisco was the only metro area to post an annual drop in home prices, down by 1% year over year
The 10- and 20-city composite indexes also decelerated further in September — up by 9.7% and 10.4% year over year, respectively — compared with 19.8% and 21.3% peak growth in April. And while the overall trend of stronger price gains in smaller markets continues to drive the 20-city index’s growth, slowing appreciation was slightly more evident in the 20-city index, as those areas tend to include more affordable markets that are being hit harder by declining buyer purchasing power.
Compared with the 2006 peak, the 10-city composite price index is now 40% higher, while the 20-city composite is up by 48%. Adjusted for inflation, which continues to remain concerningly elevated, the 10-city index is now down by 2%, while the 20-city index is up by 4% compared with its 2006 peak.
Figure 1: September Home Price Appreciation Shrinking Swiftly
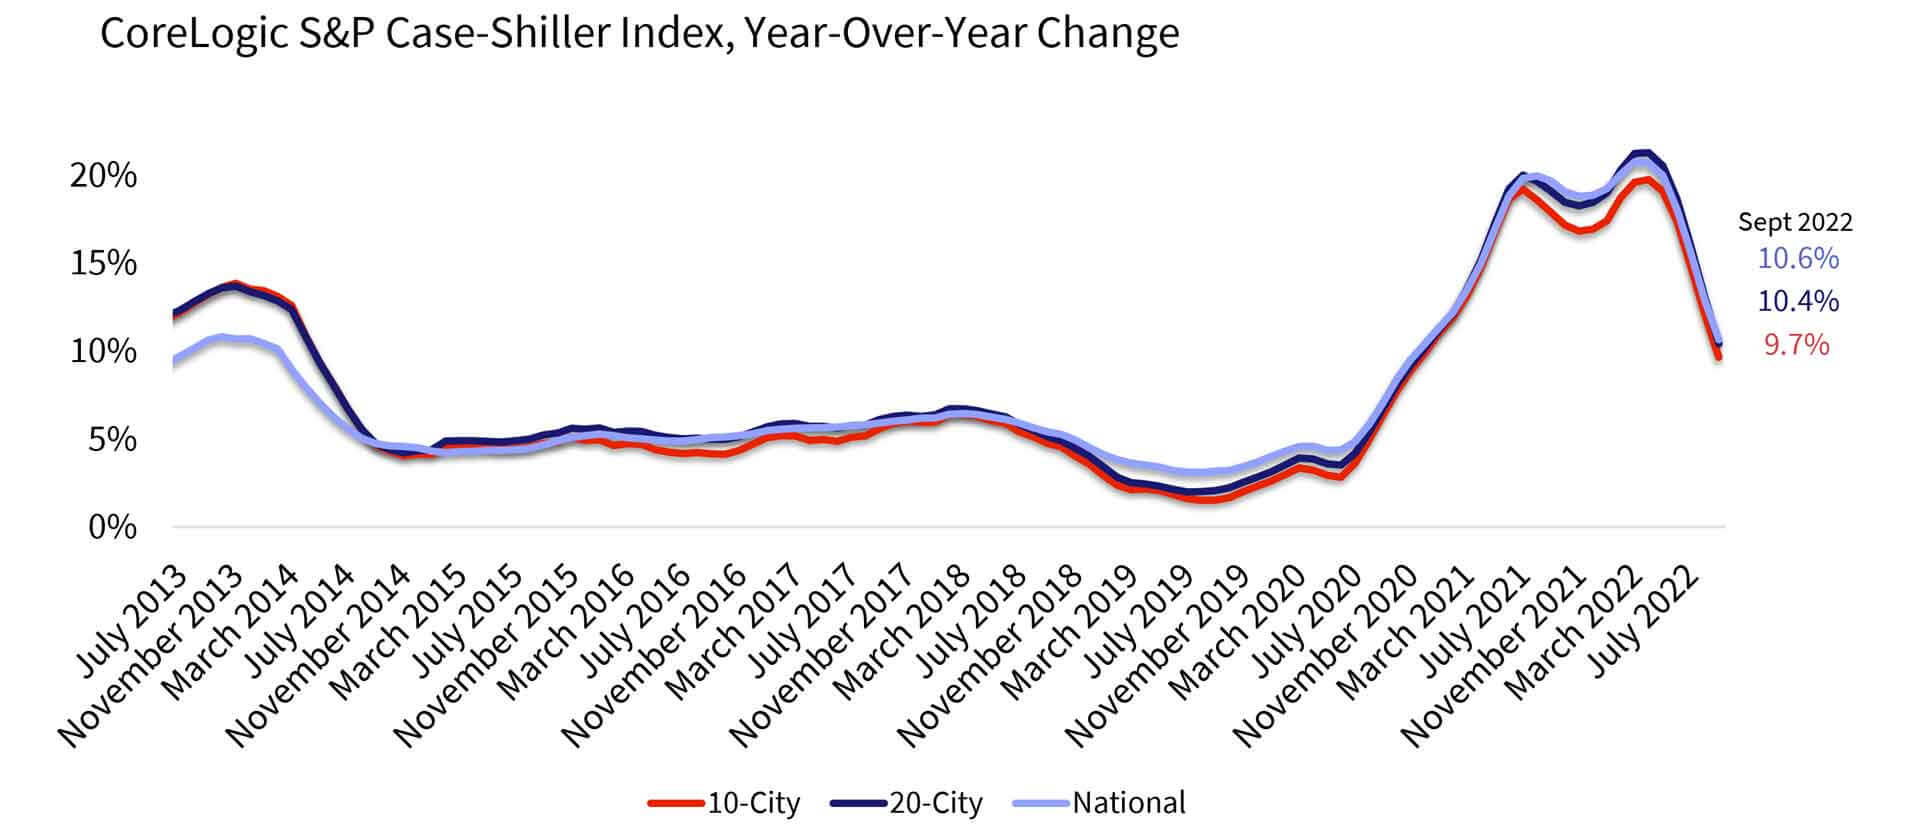
Figure 2: Month-Over-Month Price Growth Declines Again in September
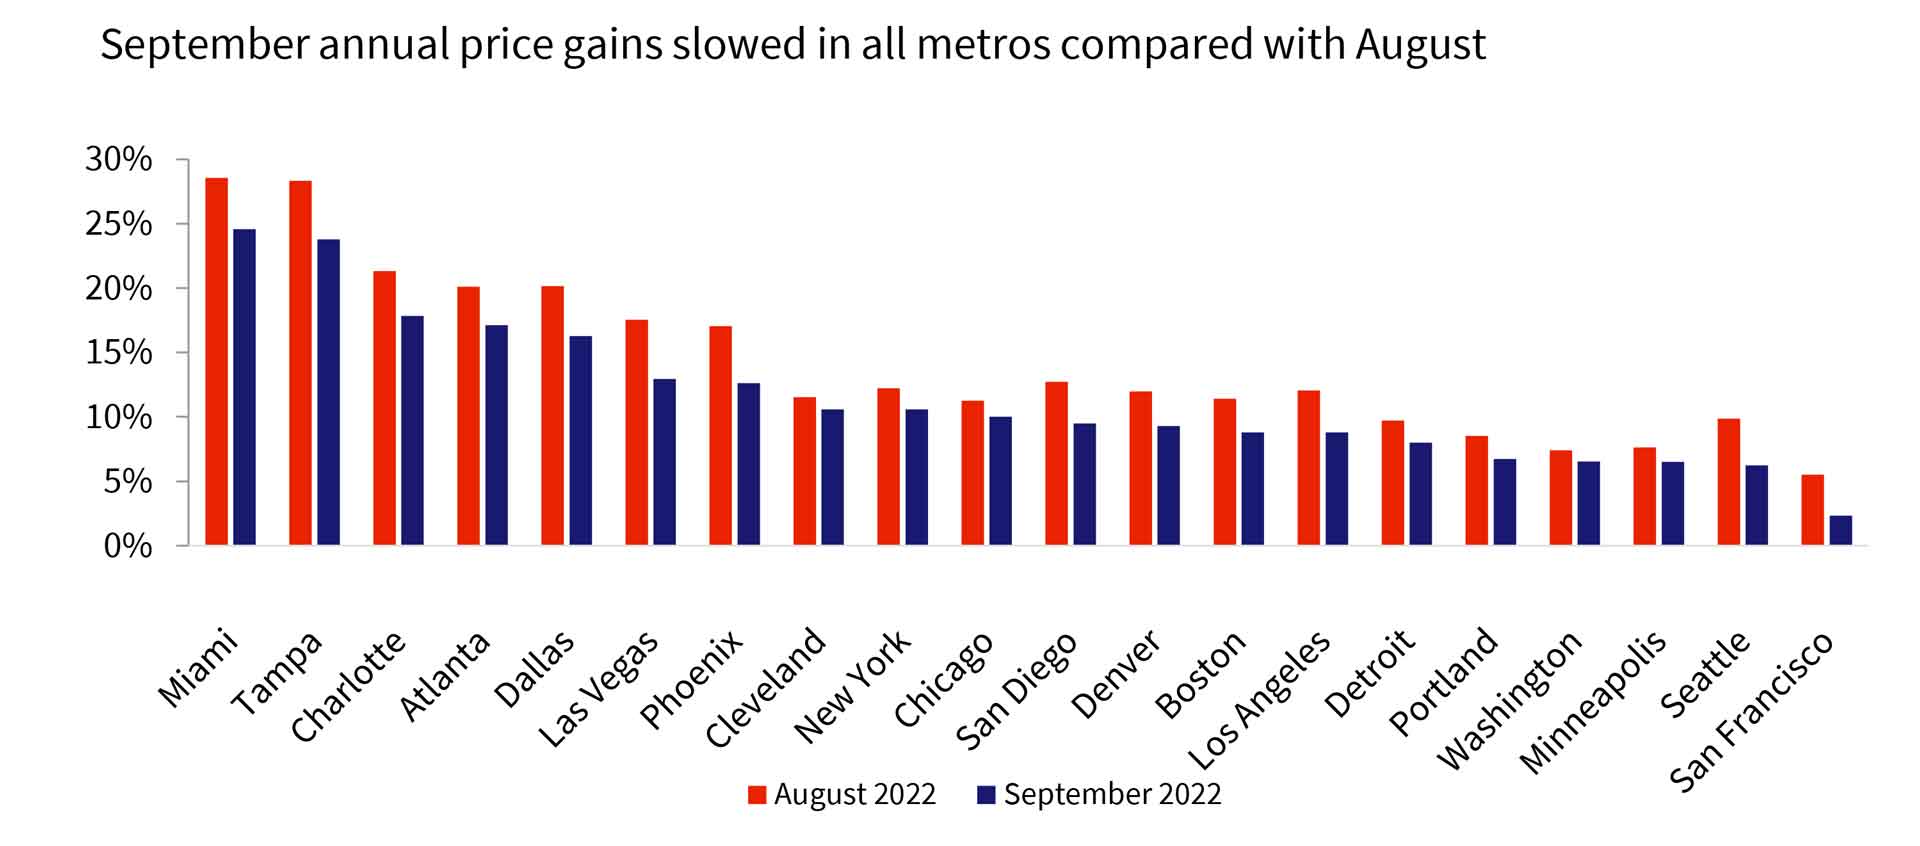
Miami posted the strongest annual home price growth among the 20 tracked markets for the second straight month, surging by 24.6% in September, down from August’s non-seasonally adjusted rate of 28.5%.
Tampa, Florida now ranks second, recording a 23.8% year-over-year gain in September, down from 28.3% in August.
Charlotte, North Carolina posted the third-highest increase, 17.8% in September. Phoenix’s rapidly slowing housing market pulled the metro down to the seventh position with a 12.6% increase — down from its peak gain of 32.9% in February.
In September, all 20 metros experienced a deceleration in annual gains (Figure 3). Las Vegas and Tampa posted the largest monthly price deceleration, both down by 4.6 percentage points. Phoenix showed the third-largest slowdown, down by 4.4 percentage points, followed by Miami – down by 4 percentage points since August. Washington and Cleveland saw the smallest declines in year-over-year gains compared with August.
Figure 3: Deceleration in Year-Over-Year Home Price Growth Seen in All 20 Metros
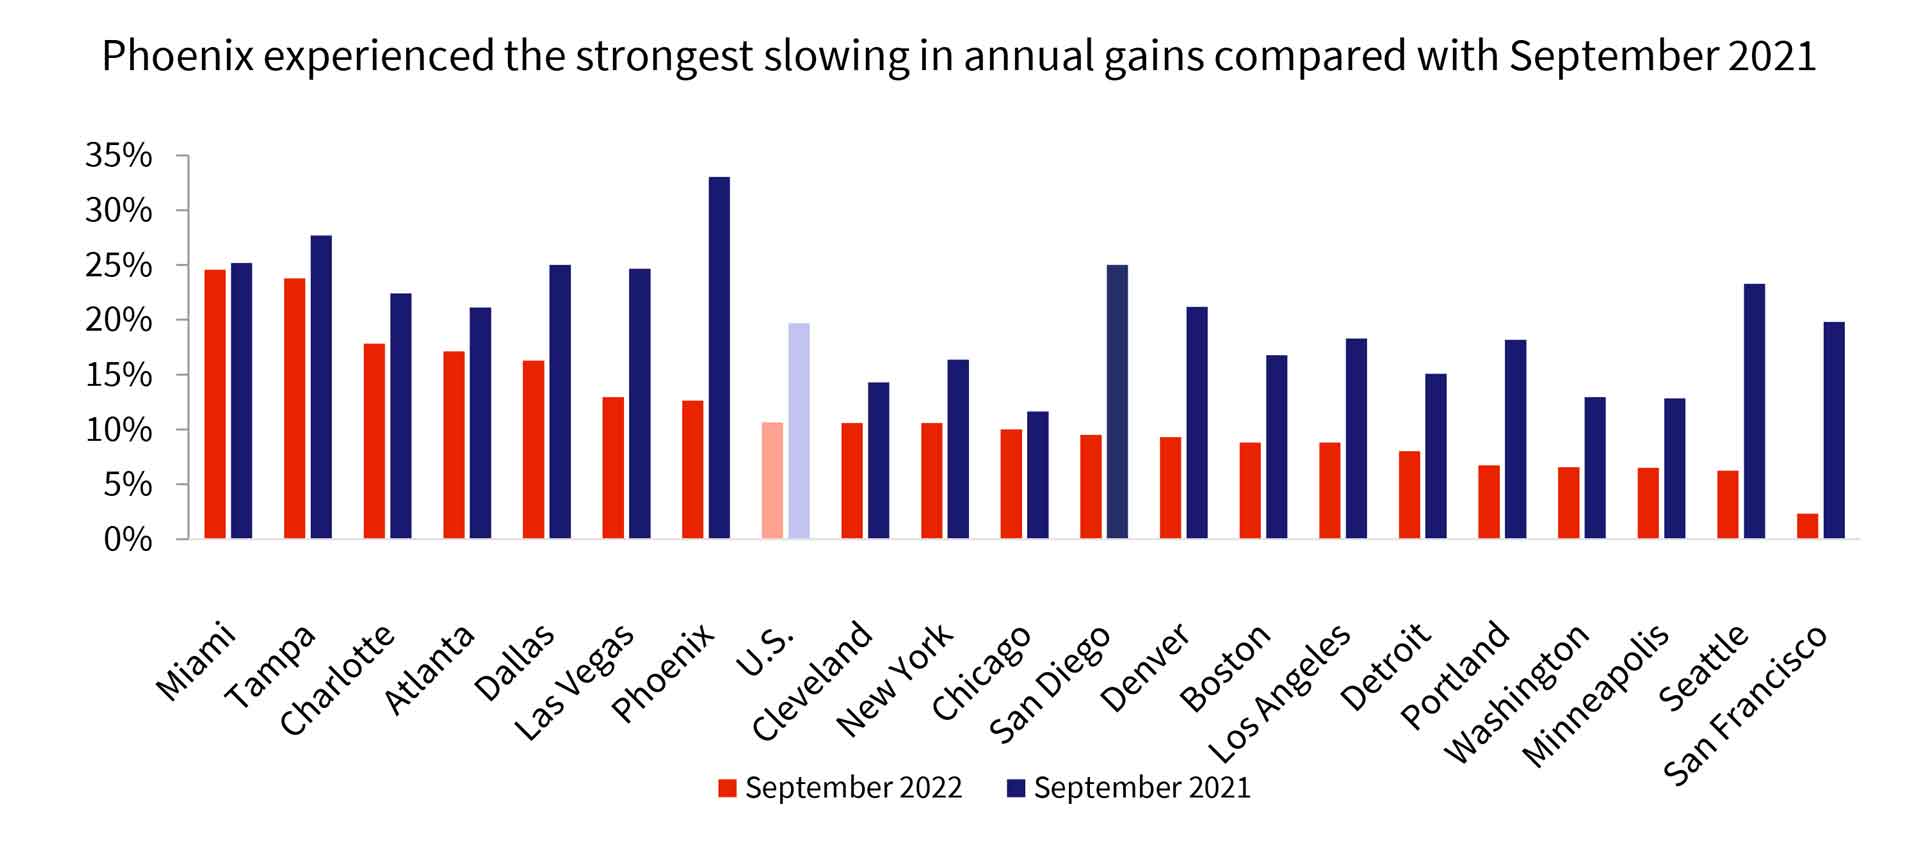
Compared with annual gains recorded last September, all metros posted weaker price gains. Phoenix showed the largest slowdown in home price growth compared with last September (as it did in August), cooling by 20.4 percentage points from one year earlier. San Francisco followed, with a 17.5 percentage point decrease (Figure 4).
Figure 4: Year-Over-Year Home Price Growth Lower in All 20 Metros
Furthermore, slowing price growth is evident across all price tiers. The low-price tier was up by 11.8% in September, while middle-tier growth slowed to 10.3% and the high tier rose by 11.1%. The high tier showed the largest deceleration in annual gains compared with August, down by 3.1 percentage points, while the low tier once again increased at the fastest pace.
From September 2021 through July 2022, high-tier price growth outpaced low-tier gains, as demand for higher-end properties persisted. At this point, the relatively smaller deceleration in the low tier could reflect continued pressure from multiple parties, including investors and owner-occupied buyers, as well as a stubbornly low inventory of homes for sale. The latest CoreLogic investor data suggests that investor activity remained steady in the fall of 2022, averaging about 100,000 properties per month nationwide across investors of all sizes, while new listings continued to fall.
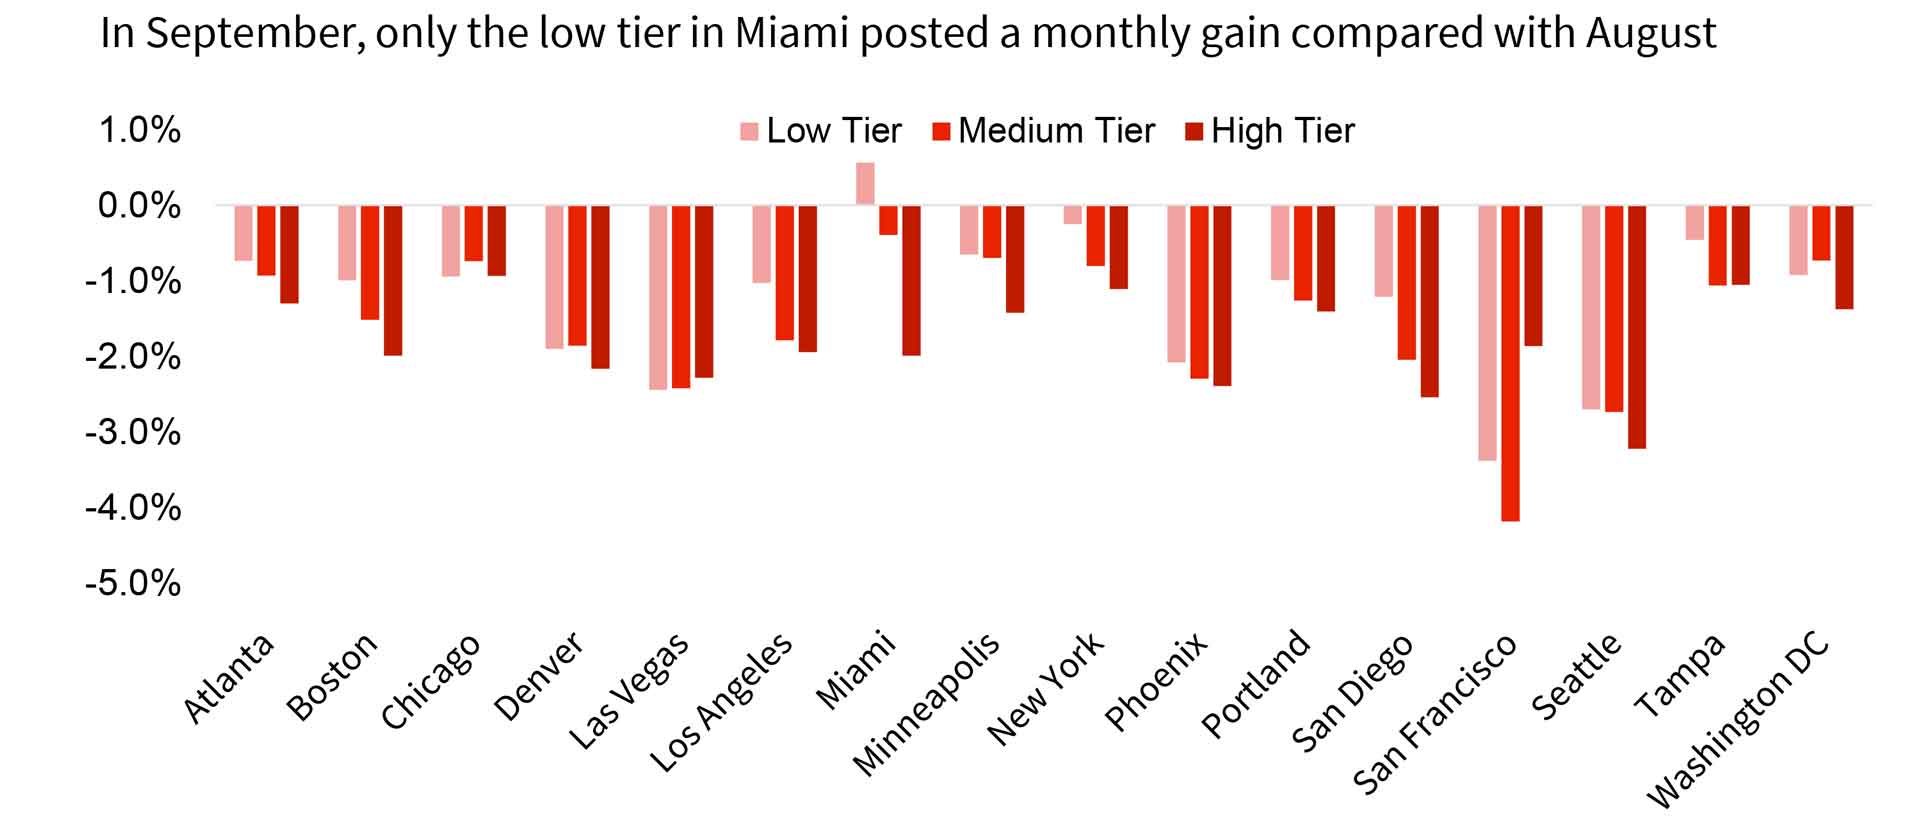
The month-over-month comparison of appreciation by price tier and location also reveals relative changes in demand across the country. From August to September, all price tiers across all metros showed declines in monthly gains, except the low tier in Miami. This is consistent with trends observed in August. Again, September has historically seen a slight increase in monthly home price gains compared with August.
The average monthly price gain among low-tier homes was down by 1.3%, though that number is not seasonally adjusted. High-tier month-over-month prices declined by 1.8% on average, while middle-tier monthly price declines averaged 1.6% (Figure 5).
Figure 5: Monthly Price Declines Average -1.3% for Low and -1.8% for High Tier
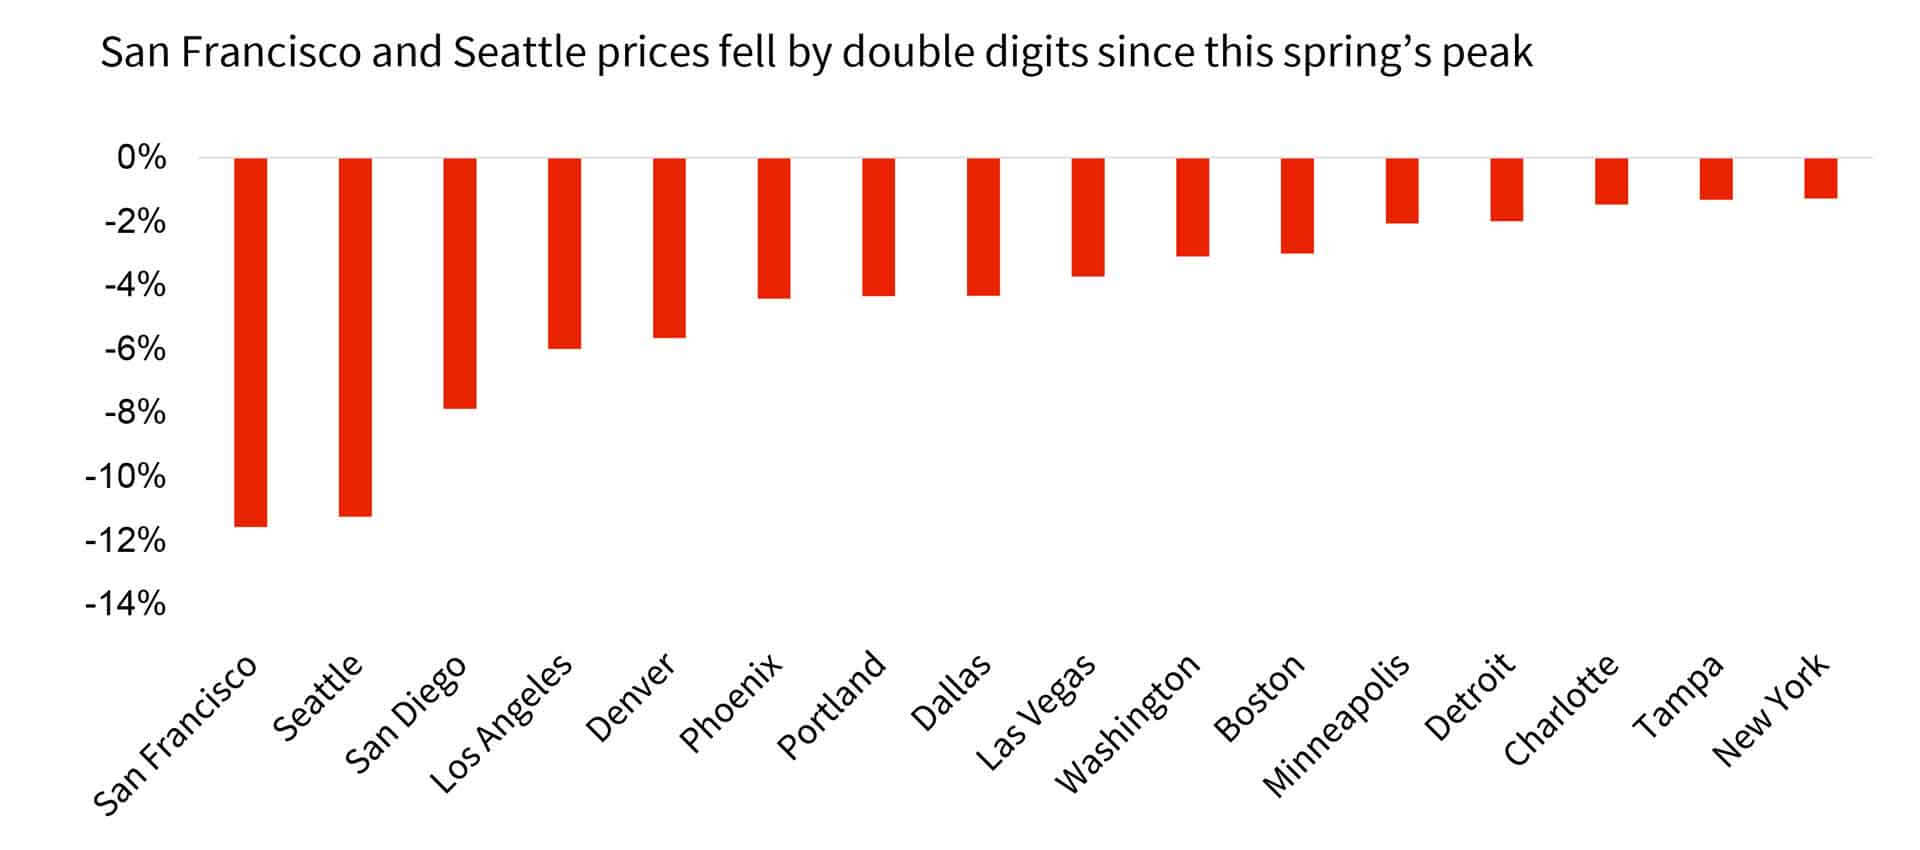
Lastly, September home prices were down in all markets compared with their respective peak month in 2022. San Francisco and Seattle posted the largest declines – down by 12% and 11% respectively. The smallest declines were seen in New York, Tampa and Charlotte, all down by about 1%. Overall, home prices were down by 3% from the spring peak (Figure 6).
Figure 6: September Prices Down by 3% From Earlier 2022 Peak
The housing market standoff continues to weigh on activity this fall. Prospective homebuyers face increasingly prohibitive ownership costs, while potential sellers contend with lower price expectations and the disincentive of giving up their favorable mortgage rates. Also, opinions suggesting price drops in 2023 are depressing consumer sentiment and have exacerbated the substantial slowing in housing market activity. In September, total home sales were down about 24% – the largest annual decline this year, with an even larger drop of 33% expected in October.
Still, while home price deceleration is likely to continue into 2023, prolonged seller reluctance and forecasts of a potentially better economic outlook and only a brief recession may keep annual appreciation flat next year, with only some regions of the country seeing price declines. In addition, the recent dip in mortgage rates could continue if future reports show progress toward moderating inflation, which may help draw some buyers off the fence and ease the deadlock.


