Home price growth in West Coast markets shows the most deceleration
Housing market activity slowed considerably over the summer, leading to widespread deceleration in home price growth and rising concerns of a real estate downturn.
In June, the CoreLogic S&P Case-Shiller Index posted an 18% increase, down from a 19.9% gain in May, marking the third month of slower annual home price appreciation. Still, due to the price acceleration of recent months, June’s year-over-year increase was the second strongest since the beginning of the data series (Figure 1). At 18.8%, June 2021 had the strongest growth recorded for that month.
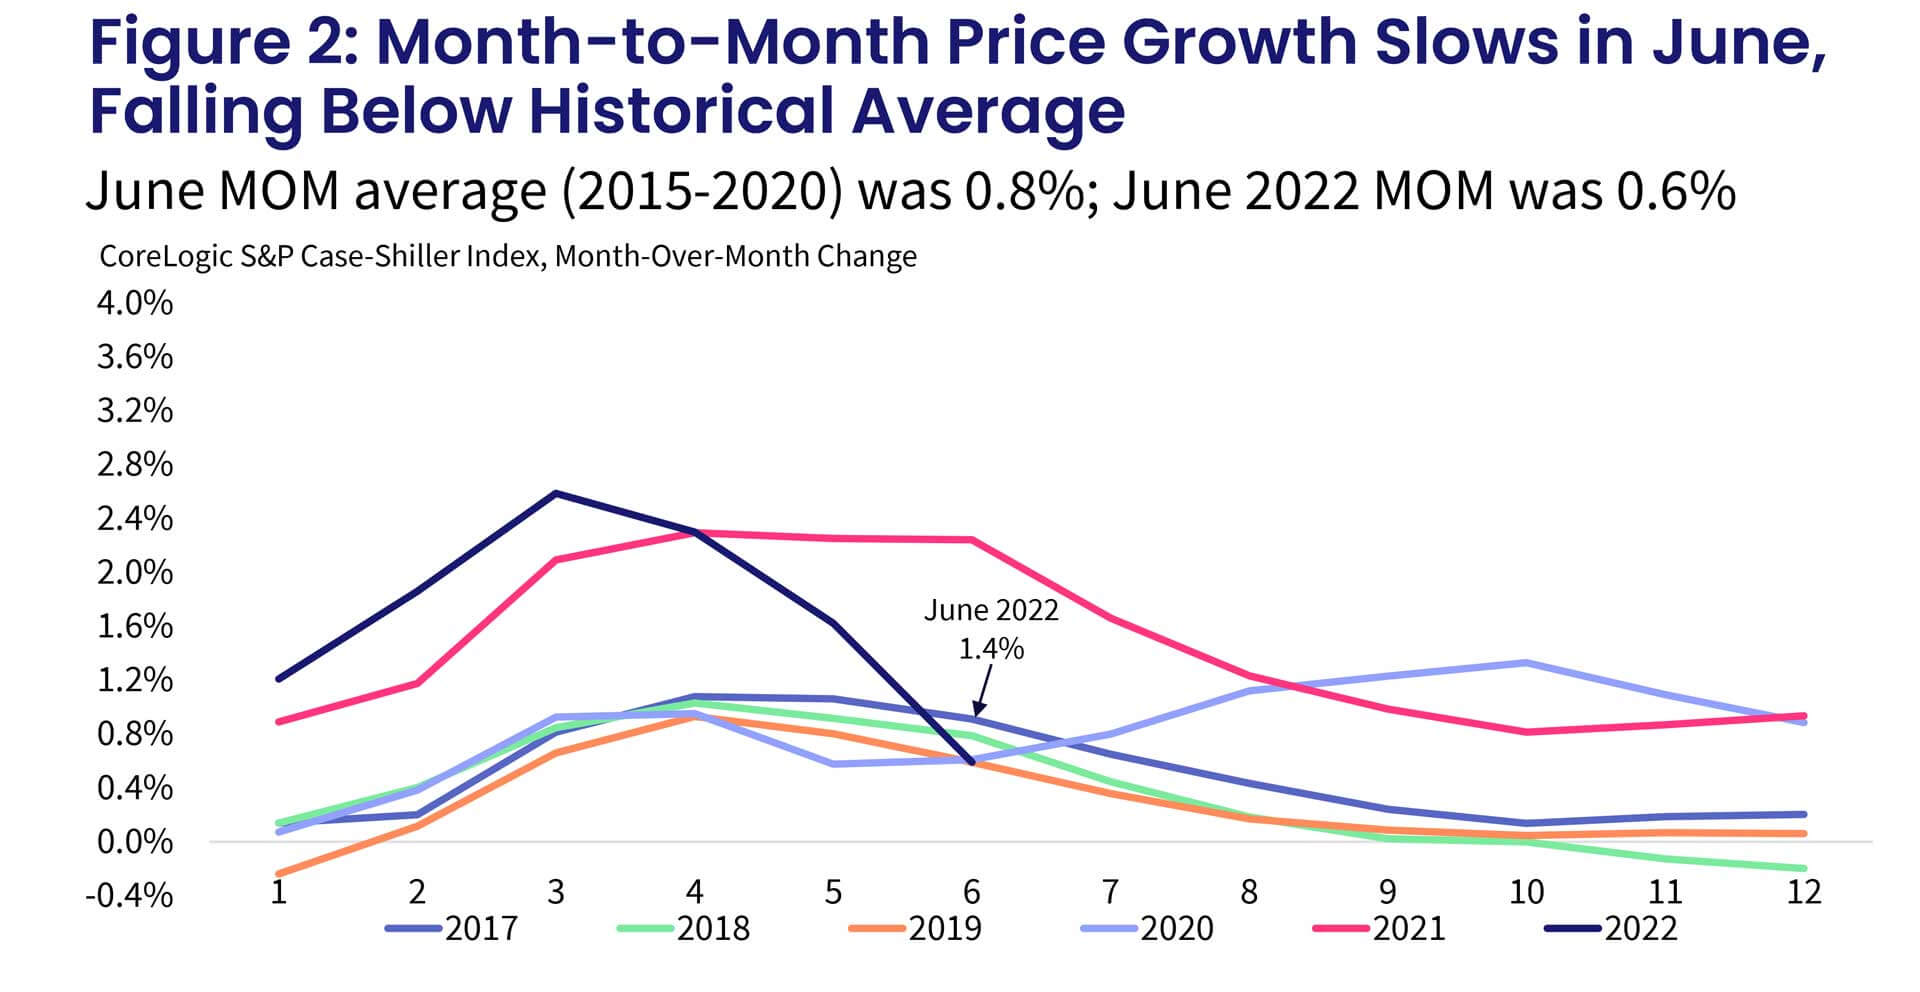
A substantial decline in the non-seasonally adjusted month-to-month index, which slowed to 0.6% in June from a 2.6% peak increase in March and a 1.6% gain in May, also suggests that home price growth is rapidly returning to its long-term average. Between 2015 and 2020, the monthly index changes from May to June averaged about 0.8% (Figure 2). CoreLogic’s Home Price Index forecasts annual home price growth to return close to its historic average in 2023 – about 6%.
Currently, year-to-date home sales are about 15% below 2021. If mortgage rates continue to hover around 5.5%, overall 2022 total home sales could see the same overall decline – around 15% lower compared with 2021. Nevertheless, if mortgage rates move beyond 6% again, housing demand is likely to dampen further and bring 2022 total sales even lower. Markets on the West Coast, particularly those in California, as well as markets that benefited from increases in second-home purchases during the COVID-19 pandemic, continue to drive the decline in sales. Meanwhile, affordable markets are still seeing home sales hold steady despite the uptick in mortgage rates.
The 10- and 20-city composite indexes also showed signs of deceleration, up by 17.4% and 18.6% year over year, respectively, compared with 19.1% and 20.5% in May. The overall tendency for more price increases in smaller markets continues to drive the 20-city index growth higher, as buyers flock to smaller and more affordable areas, particularly those in the Southeast and Florida.
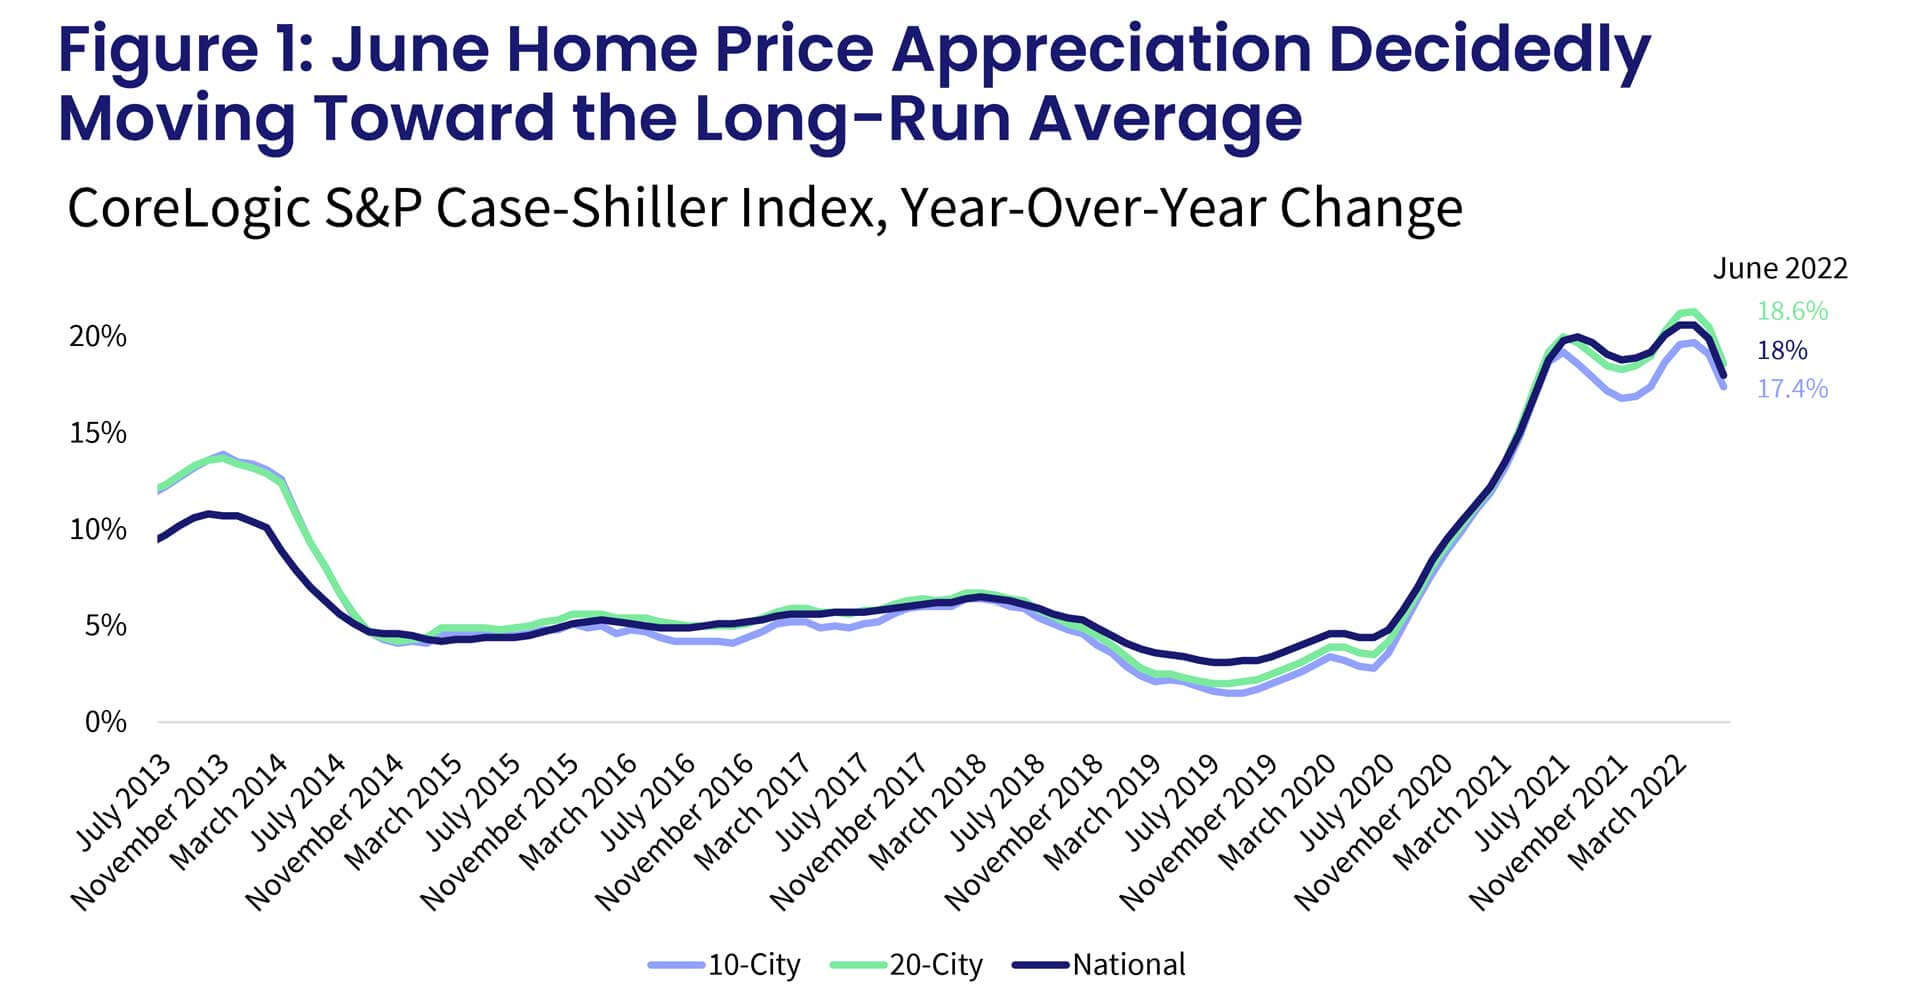
Compared with the 2006 peak, the 10-city composite is now 46% higher, while the 20-city composite is up by 54%. Adjusted for inflation, which continues to remain elevated, the 10-city index is now up by 2%, while the 20-city index is up by 7% compared with the 2006 peak.
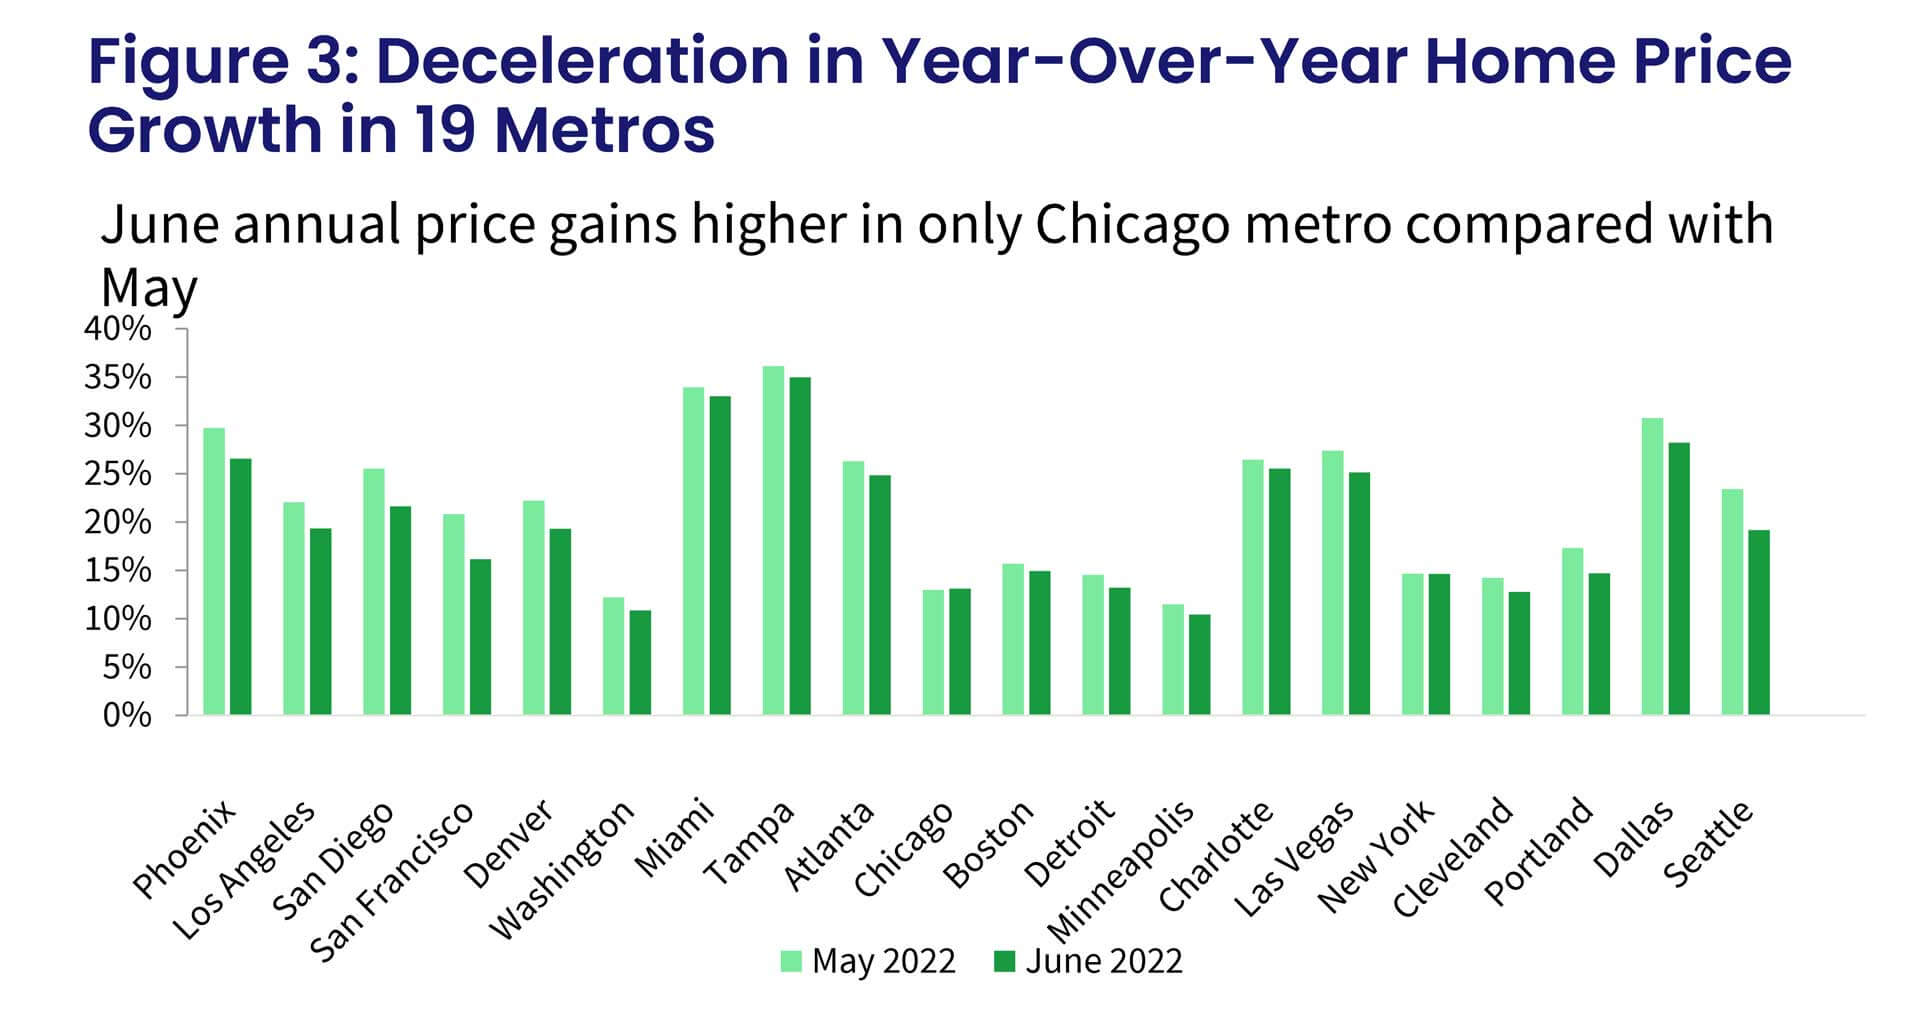
For the fourth straight month, Tampa, Florida posted the strongest annual home price growth among the 20 tracked markets, surging by 35% in June, down from May’s non-seasonally adjusted rate of 36.1%.
Miami ranked second, recording a 33% year-over-year gain in June, down from 33.9% the month before. Dallas now ranks third, with a 28.2% increase in June, while Phoenix fell to the fourth position with a 26.6% jump – down from February’s 32.9% gain, when it last held the index’s strongest price growth position.
San Francisco, Seattle and San Diego posted the largest slowdowns in annual gains compared with May. Chicago, up by 13.3%, was the only metro that posted an increase in annual gains over the last two months.
Minneapolis and Washington continued to post the slowest increases in annual gains, a respective 10.4% and 10.8%. Despite having the slowest rate of annual price increases, these metros have still experienced double-digit growth rates for 19 consecutive months.
Nineteen out of 20 metro areas experienced a deceleration in annual gains in June, from 13 in May. (Figure 3).
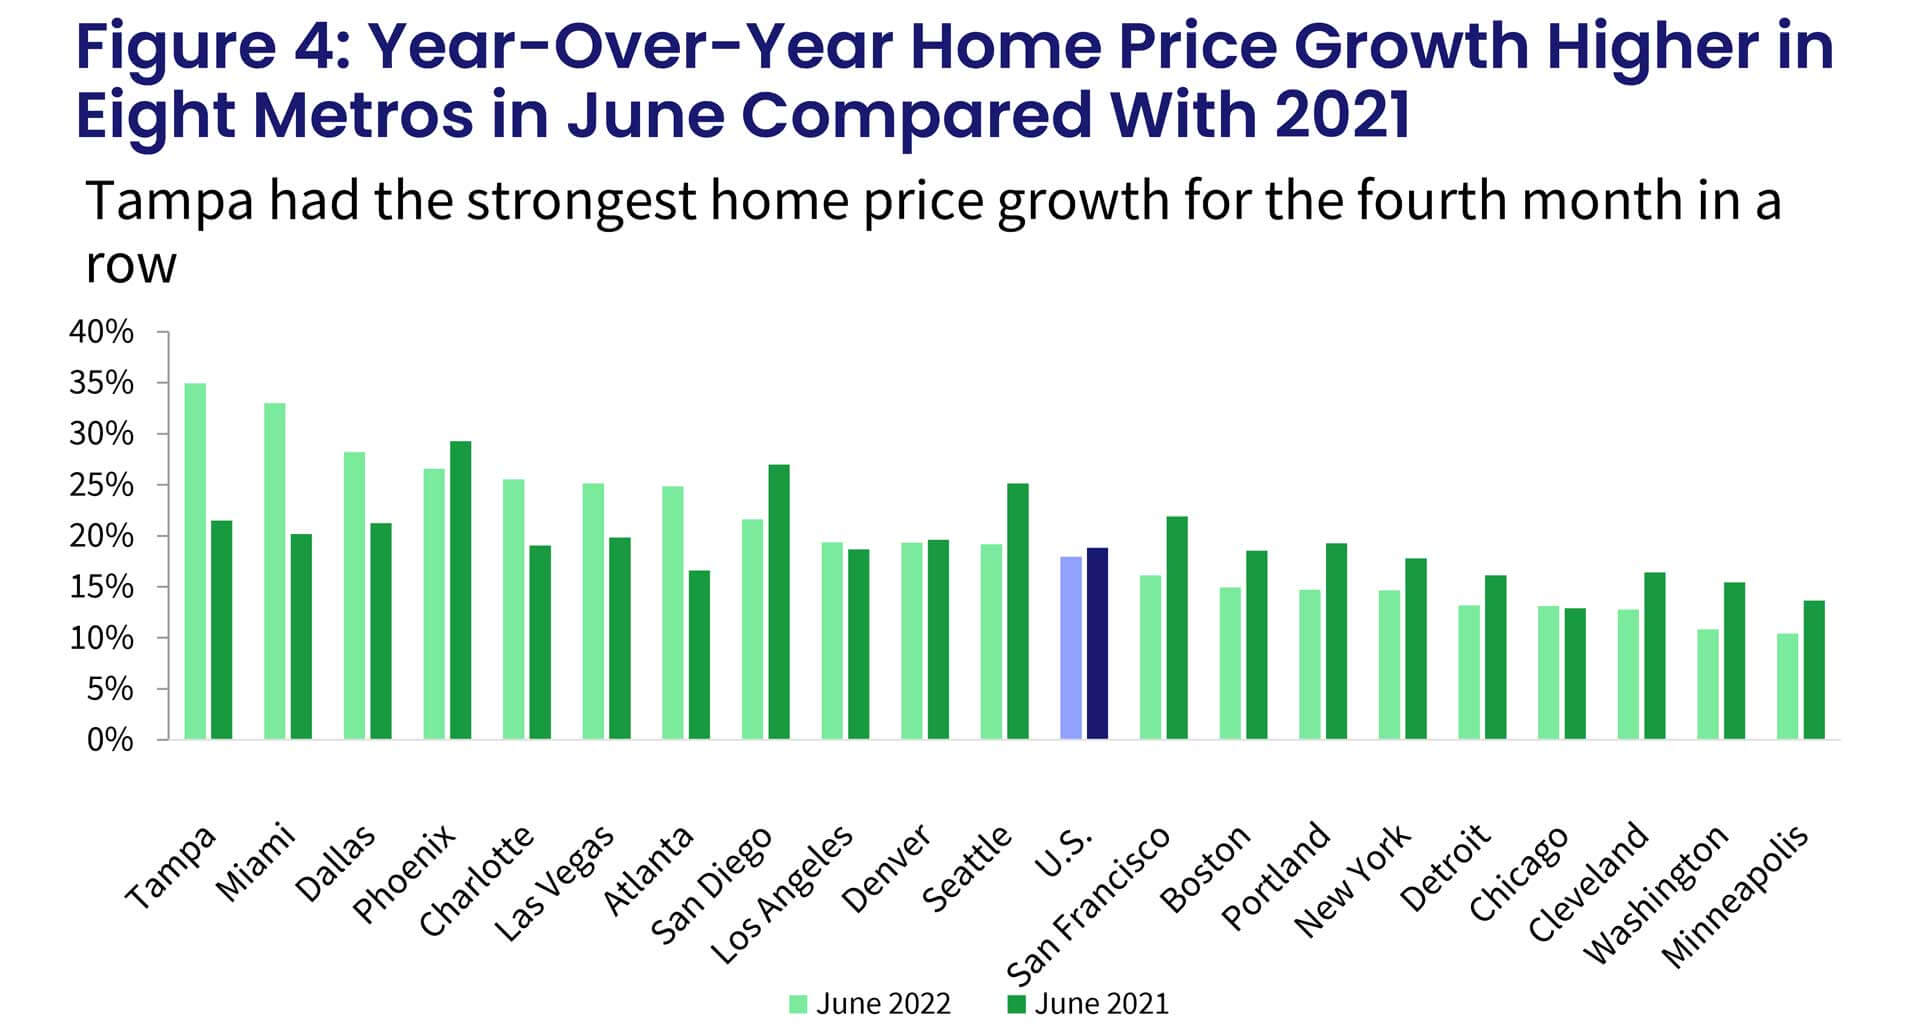
Compared with annual gains recorded last June, 12 metros continued to see stronger increases. Again, the same West Coast cities posted the largest slowdown in gains compared with last June as last month. Seattle showed the largest decline, down by 6 percentage points, followed by San Francisco (down by 5.8 percentage points) and San Diego (down by 5.4 percentage points).
On the other hand, Tampa and Miami were up by as much as 13 to 14 percentage points in just one year (Figure 4).
Furthermore, all three price tiers also showed slower annual gains. The low-price tier was up by 19.4% in June, while the middle tier slowed to 18.6% and the high tier was up by 20.7%. The high tier had the largest deceleration in annual gains compared with May, down 2.3 percentage points, even though it is still averaging higher rate of growth compared with more affordable tiers. Relatively smaller deceleration in the low tier could reflect continued pressured from multiple buyers, including first-time and move-up purchasers, but also from investors who remain present in some markets despite an overall decline in their activity since the surge in mortgage rates.
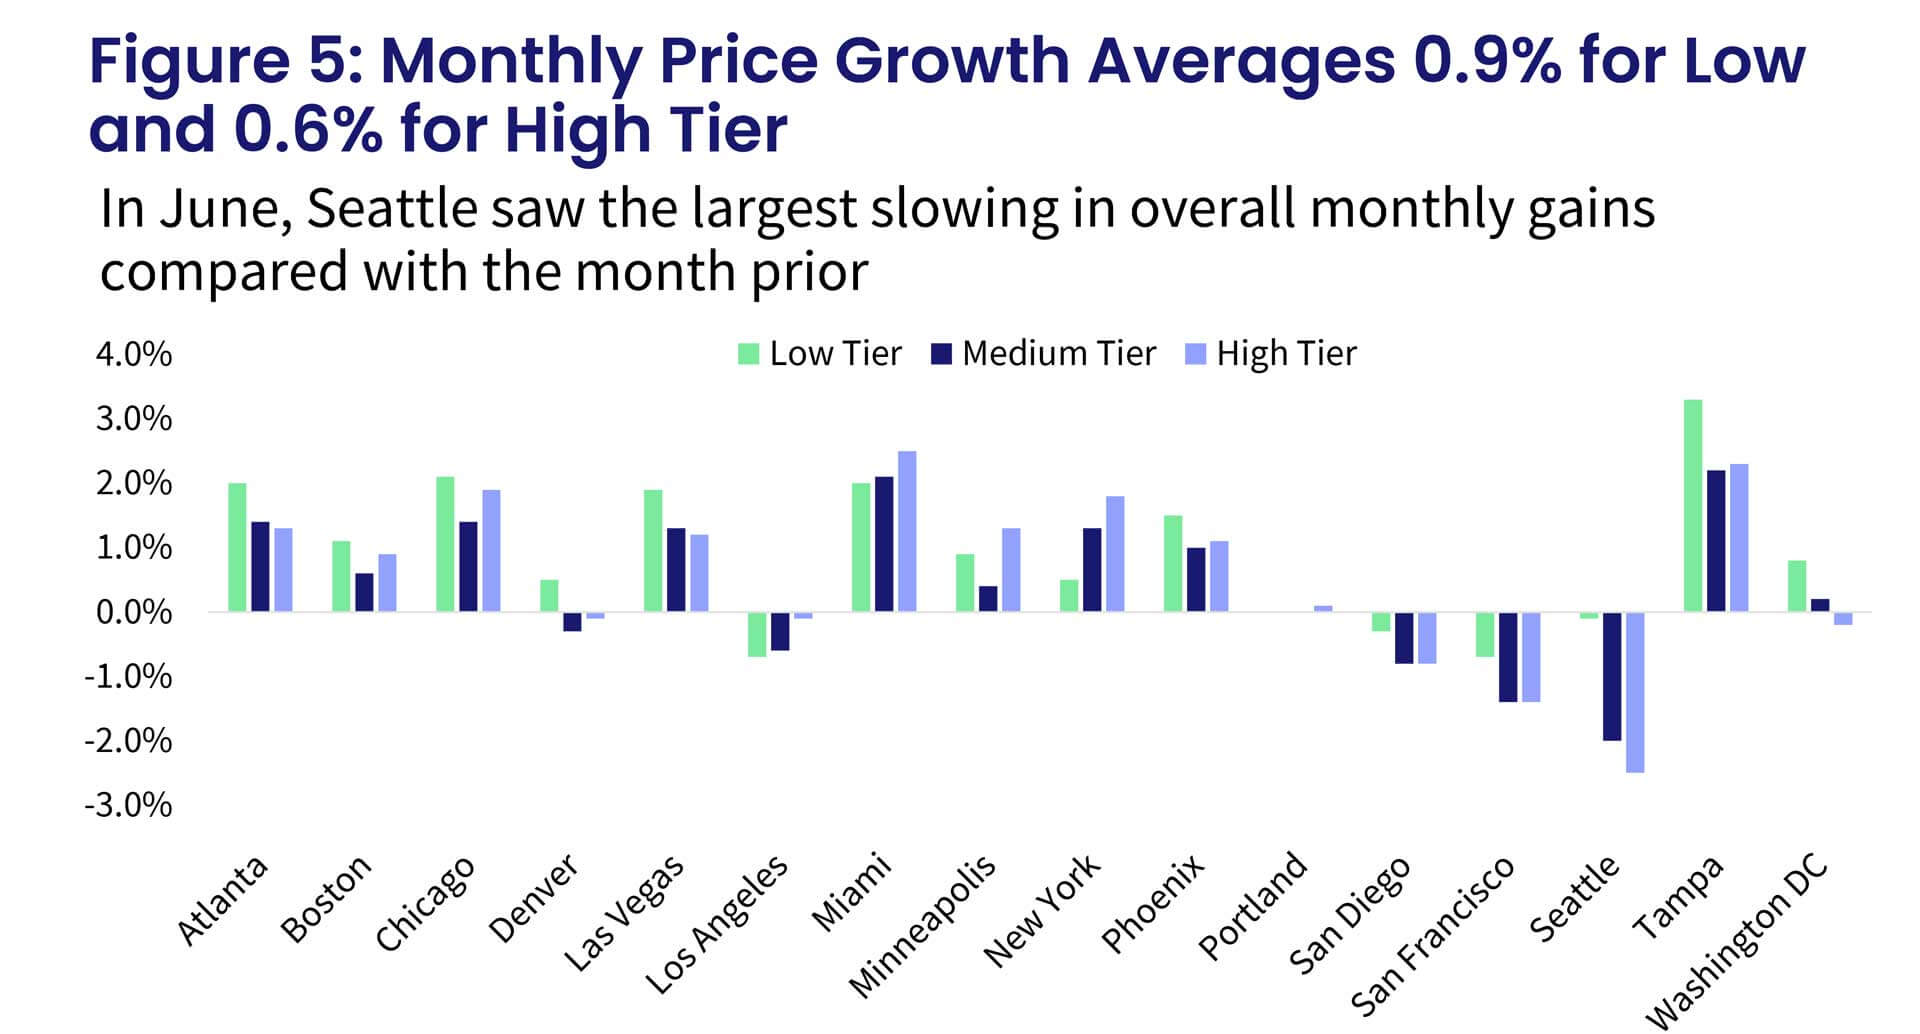
The month-over-month comparison of appreciation by price tier and location also reveals relative changes in demand across the country. From May to June, the pricier Western metros – particularly Seattle; San Francisco; San Diego; Los Angeles; Portland, Oregon and Denver – showed declines in monthly gains. In fact, June was the first month of monthly declines in a number of metros. Again, June has historically seen an increase in monthly home price gains compared with May
The largest monthly gains were again in the South, including Miami and Tampa, where prices were up notably in June.
The average monthly price gain among low-tier homes was 0.9% June, though that number is not seasonally adjusted. The high-tier monthly gain averaged 0.6% in June, while middle-tier monthly price increases averaged 0.4% (Figure 5).
The rebalancing of buyer and seller expectations was inevitable after overheated and unsustainable demand and price growth, followed by a surge in mortgage rates and the resulting affordability constraints. Thus, cooling price acceleration, as well as demand, will yield a healthier and more balanced housing market going forward. Home purchase activity for the remainder of 2022 will largely depend on mortgage rate movement. With rates slowing from June’s peak, the coming months may see some improvement in homebuying demand, particularly as shoppers perceive lower rates as an opportunity to enter the market. Nevertheless, buyer choices will remain limited given that sellers have also pulled back listing homes since June’s mortgage rate surge.


