Middle Price Tier Shows More Weakened Growth Compared to Low or High Tier
There were unexpected economic and financial twists in 2021, and the housing market experienced its fair share of surprises. Demand continued to surge and exceeded 2020 levels while availability of for-sale homes in many locales continued to decline to record-low levels. Consequently, the latest S&P CoreLogic Case-Shiller slowed for the second consecutive month and was up 19.1% year over year, down from the 19.7% increase the month prior.
The month-to-month index also slowed to a non-seasonally adjusted 0.84%, down from a 0.97% increase in September. Nevertheless, while the monthly gains have slowed, they are still notably above the average 0.43% decline seen between 2006 and 2019, suggesting the October 2021 increase is still beating the seasonal decline typical of October.
October marks the sixth consecutive month of slowing monthly gains. The peak occurred in April 2021 when the non-seasonally adjusted monthly increase jumped to 2.32% (April’s monthly gains generally averaged 1% from 2006 to 2020). As monthly gains continue to decelerate, so too will the rate of annual home price appreciation. According to the latest CoreLogic HPI Forecast, home price growth will slow to about 3% by the last quarter of 2022. However, some markets with exceptionally limited inventory and strong income growth may experience lesser declines.
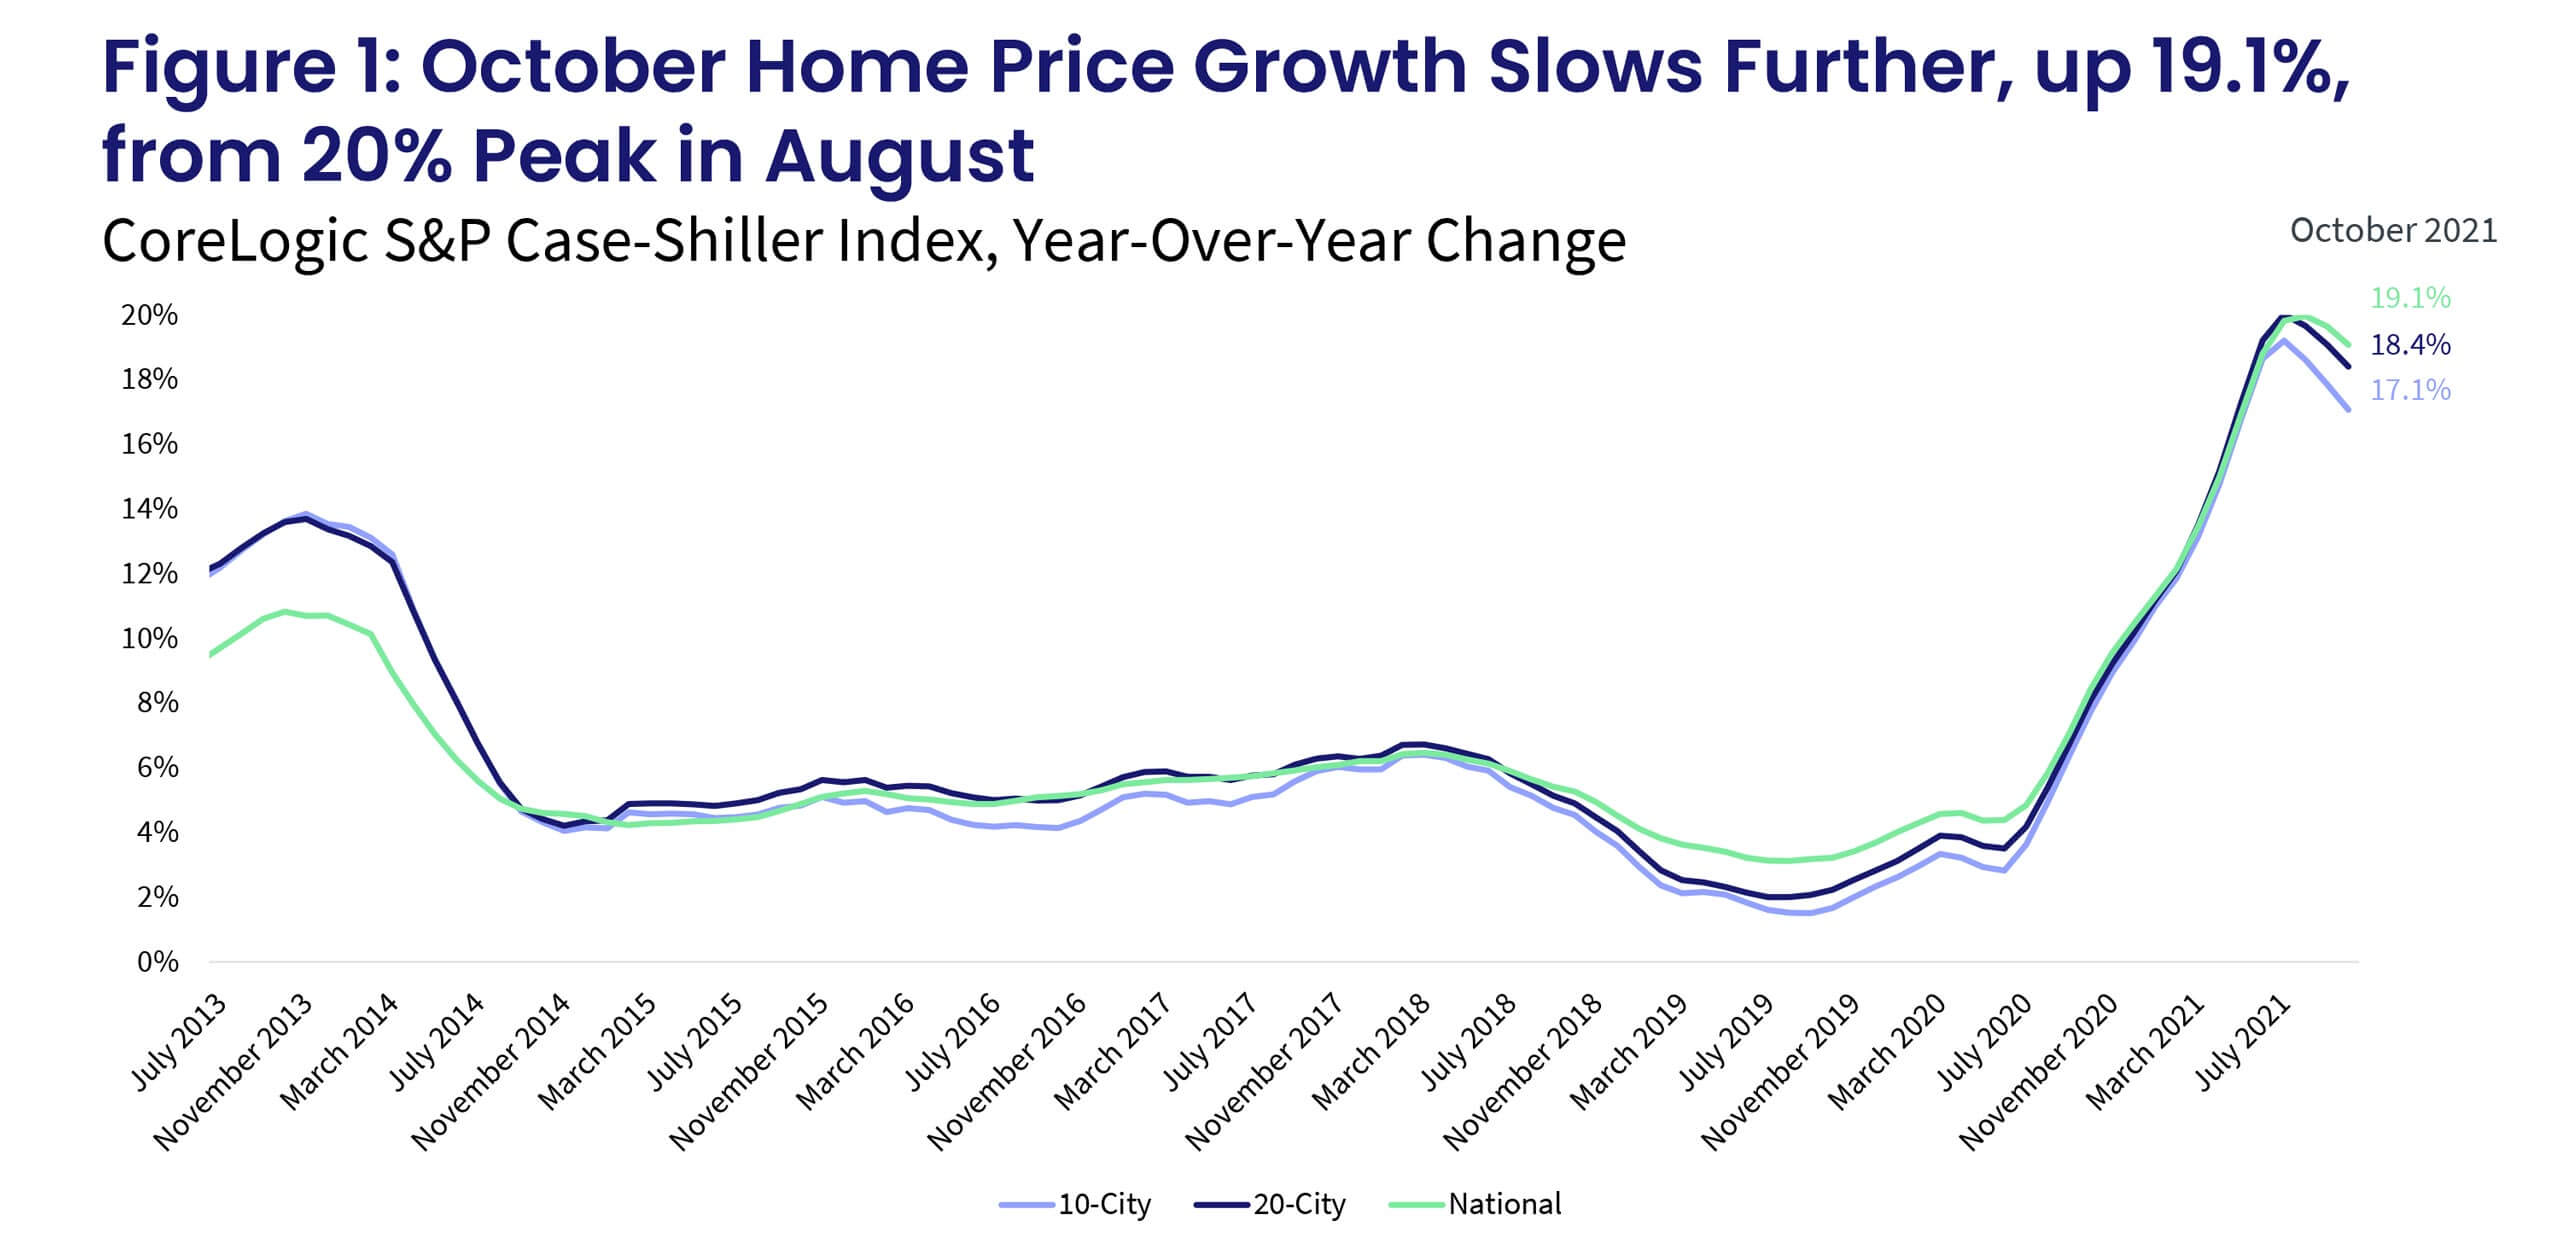
Acceleration of the 10- and 20-city composite indexes also continued to slow from July peak gains, and were up 17.1% and 18.4% year over year, respectively. In July, the indexes recorded gains of 19.2% and 20%, respectively (Figure 1). Robust demand in smaller, warmer and more affordable areas is reflected in continually stronger gains in the 20-city index.
Compared to the 2006 peak, the 10-city composite is now 29% higher, while the 20-city composite is 35% higher. Adjusted for inflation, the 10-city index is down 3%, while the 20-city index is up 2% compared to the 2006 peak.
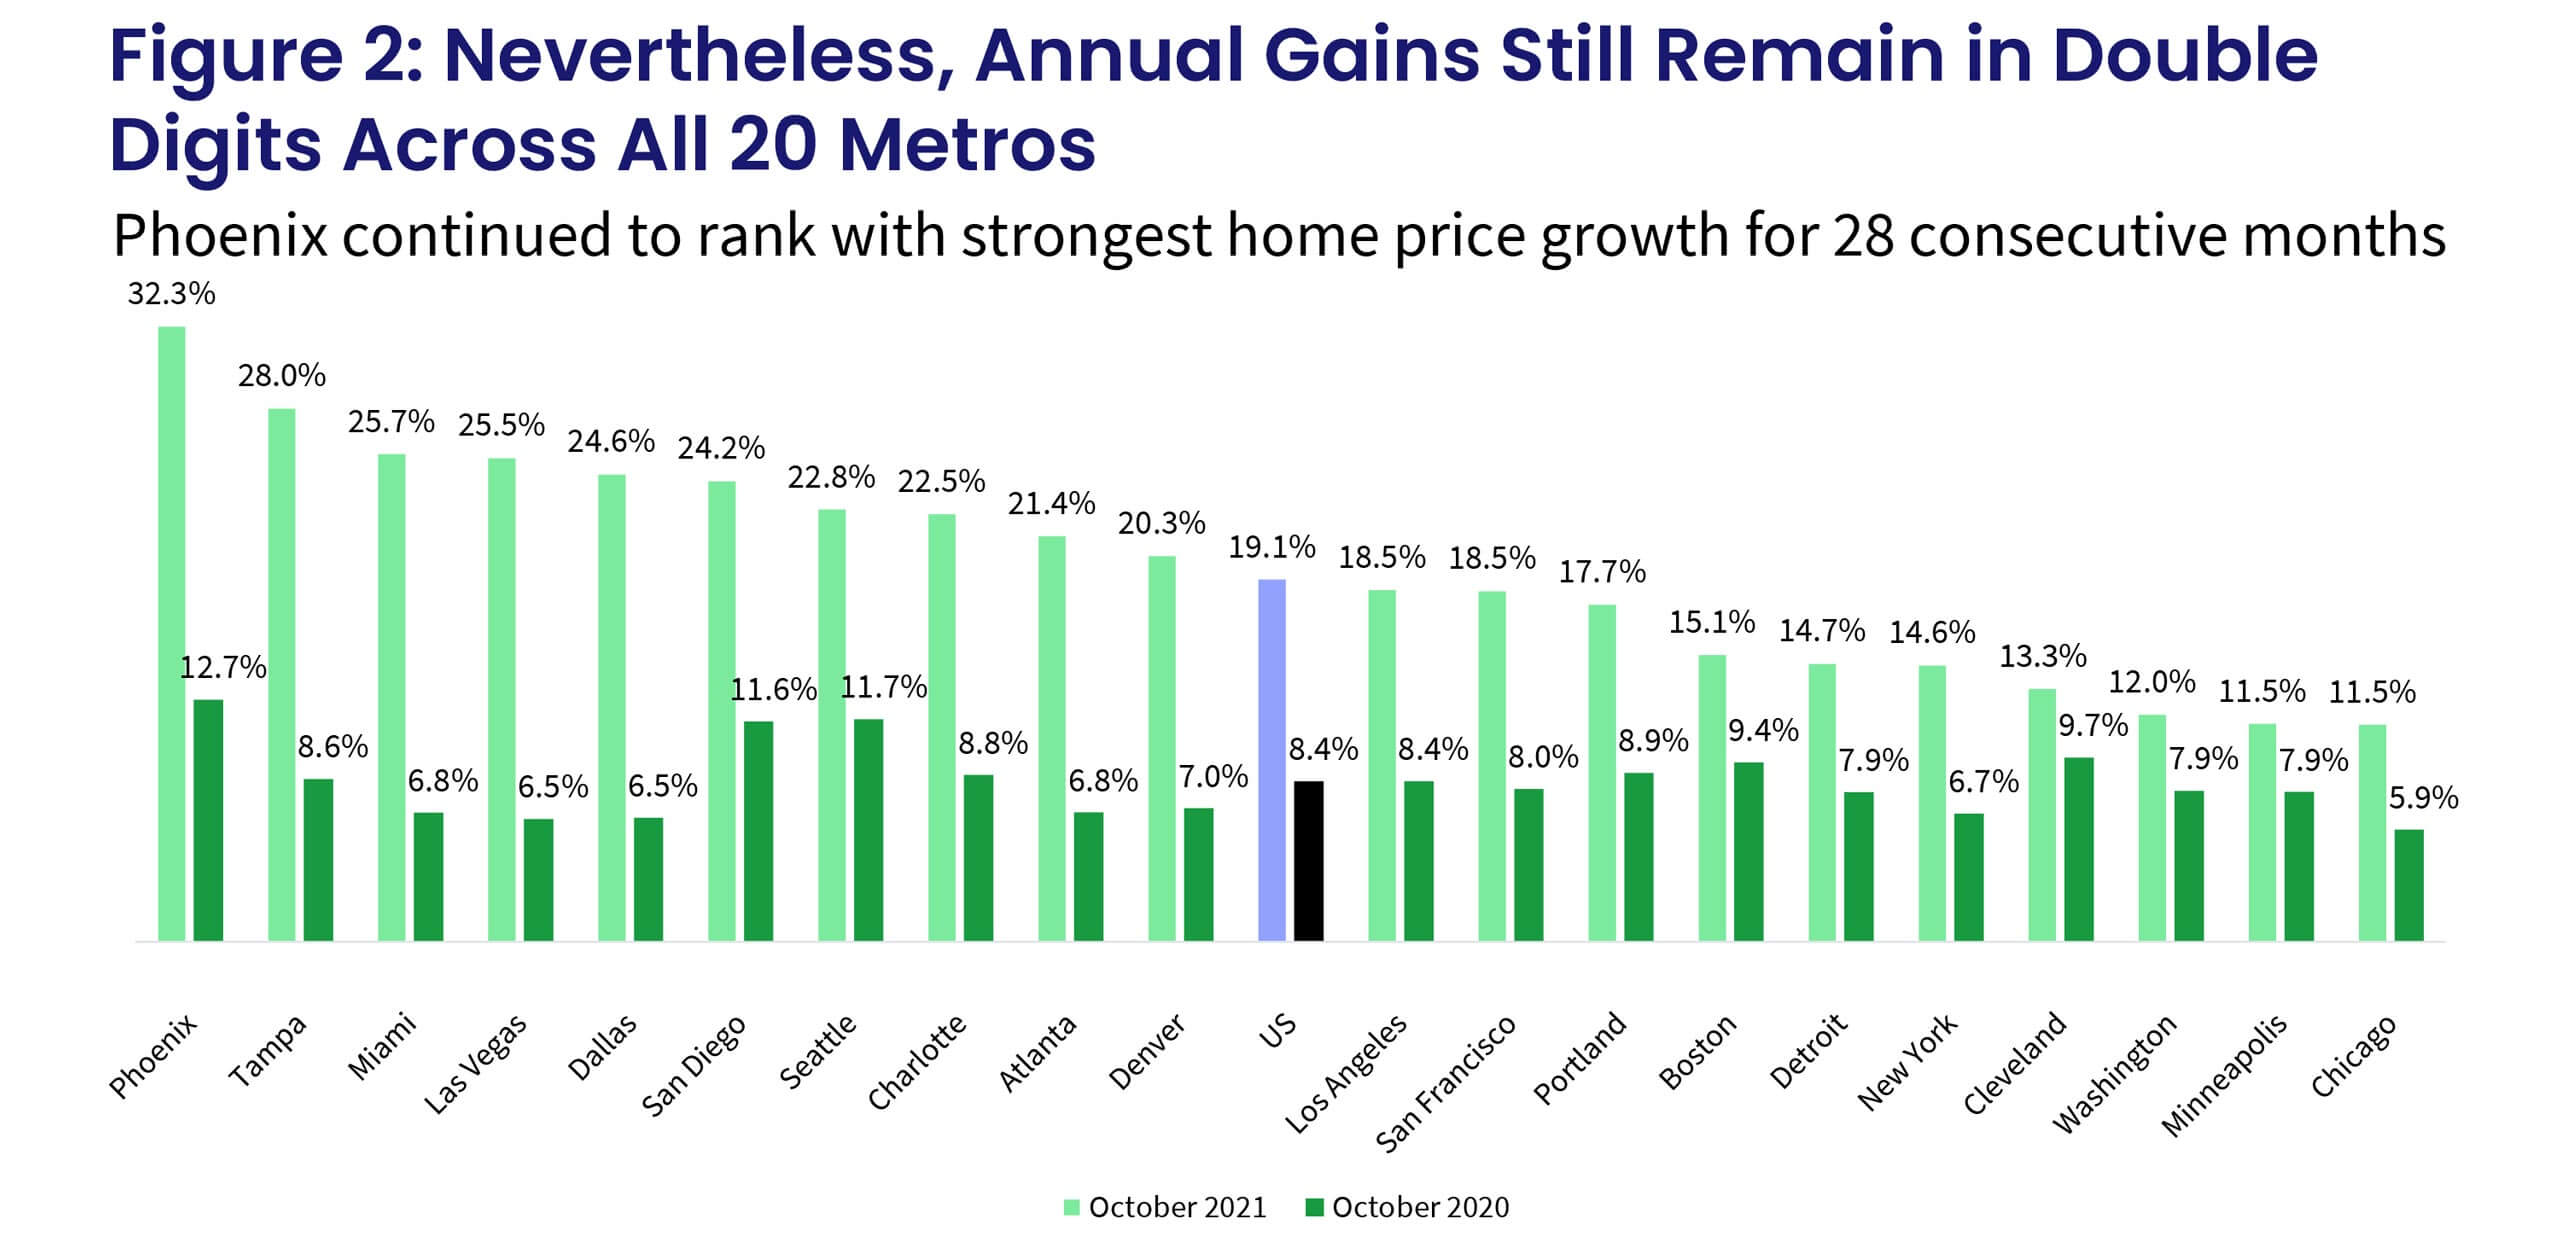
For the 28th consecutive month, Phoenix had the strongest home price growth among the 20 markets, surging 32.3% in October, but is down from September’s non-seasonally adjusted rate of 33.1%.
Tampa, Florida, ranks 2nd with a 29% gain, while Miami ranks 3rd with a 25.7% increase in October. Both cities have experienced acceleration in annual gains. Four other metro areas experienced acceleration in annual gains since September, including Las Vegas, Los Angeles, Atlanta and Charlotte, North Carolina.
Home price growth in San Diego, which has been trending near the top of the 20-city list since the onset of the pandemic, slowed to a 24.2% annual increase, bumping it down to the 6th place for strongest home price growth.
Chicago and Minneapolis are still the laggers, both up 11.5% in October. Metros with the largest slowdown in annual gains are Washington (from 13.7% to 12%) and Boston (from 16.8% to 15.1%). Fifteen out of 20 cities are experiencing a slowdown in year-over-year gains (Figure 2).
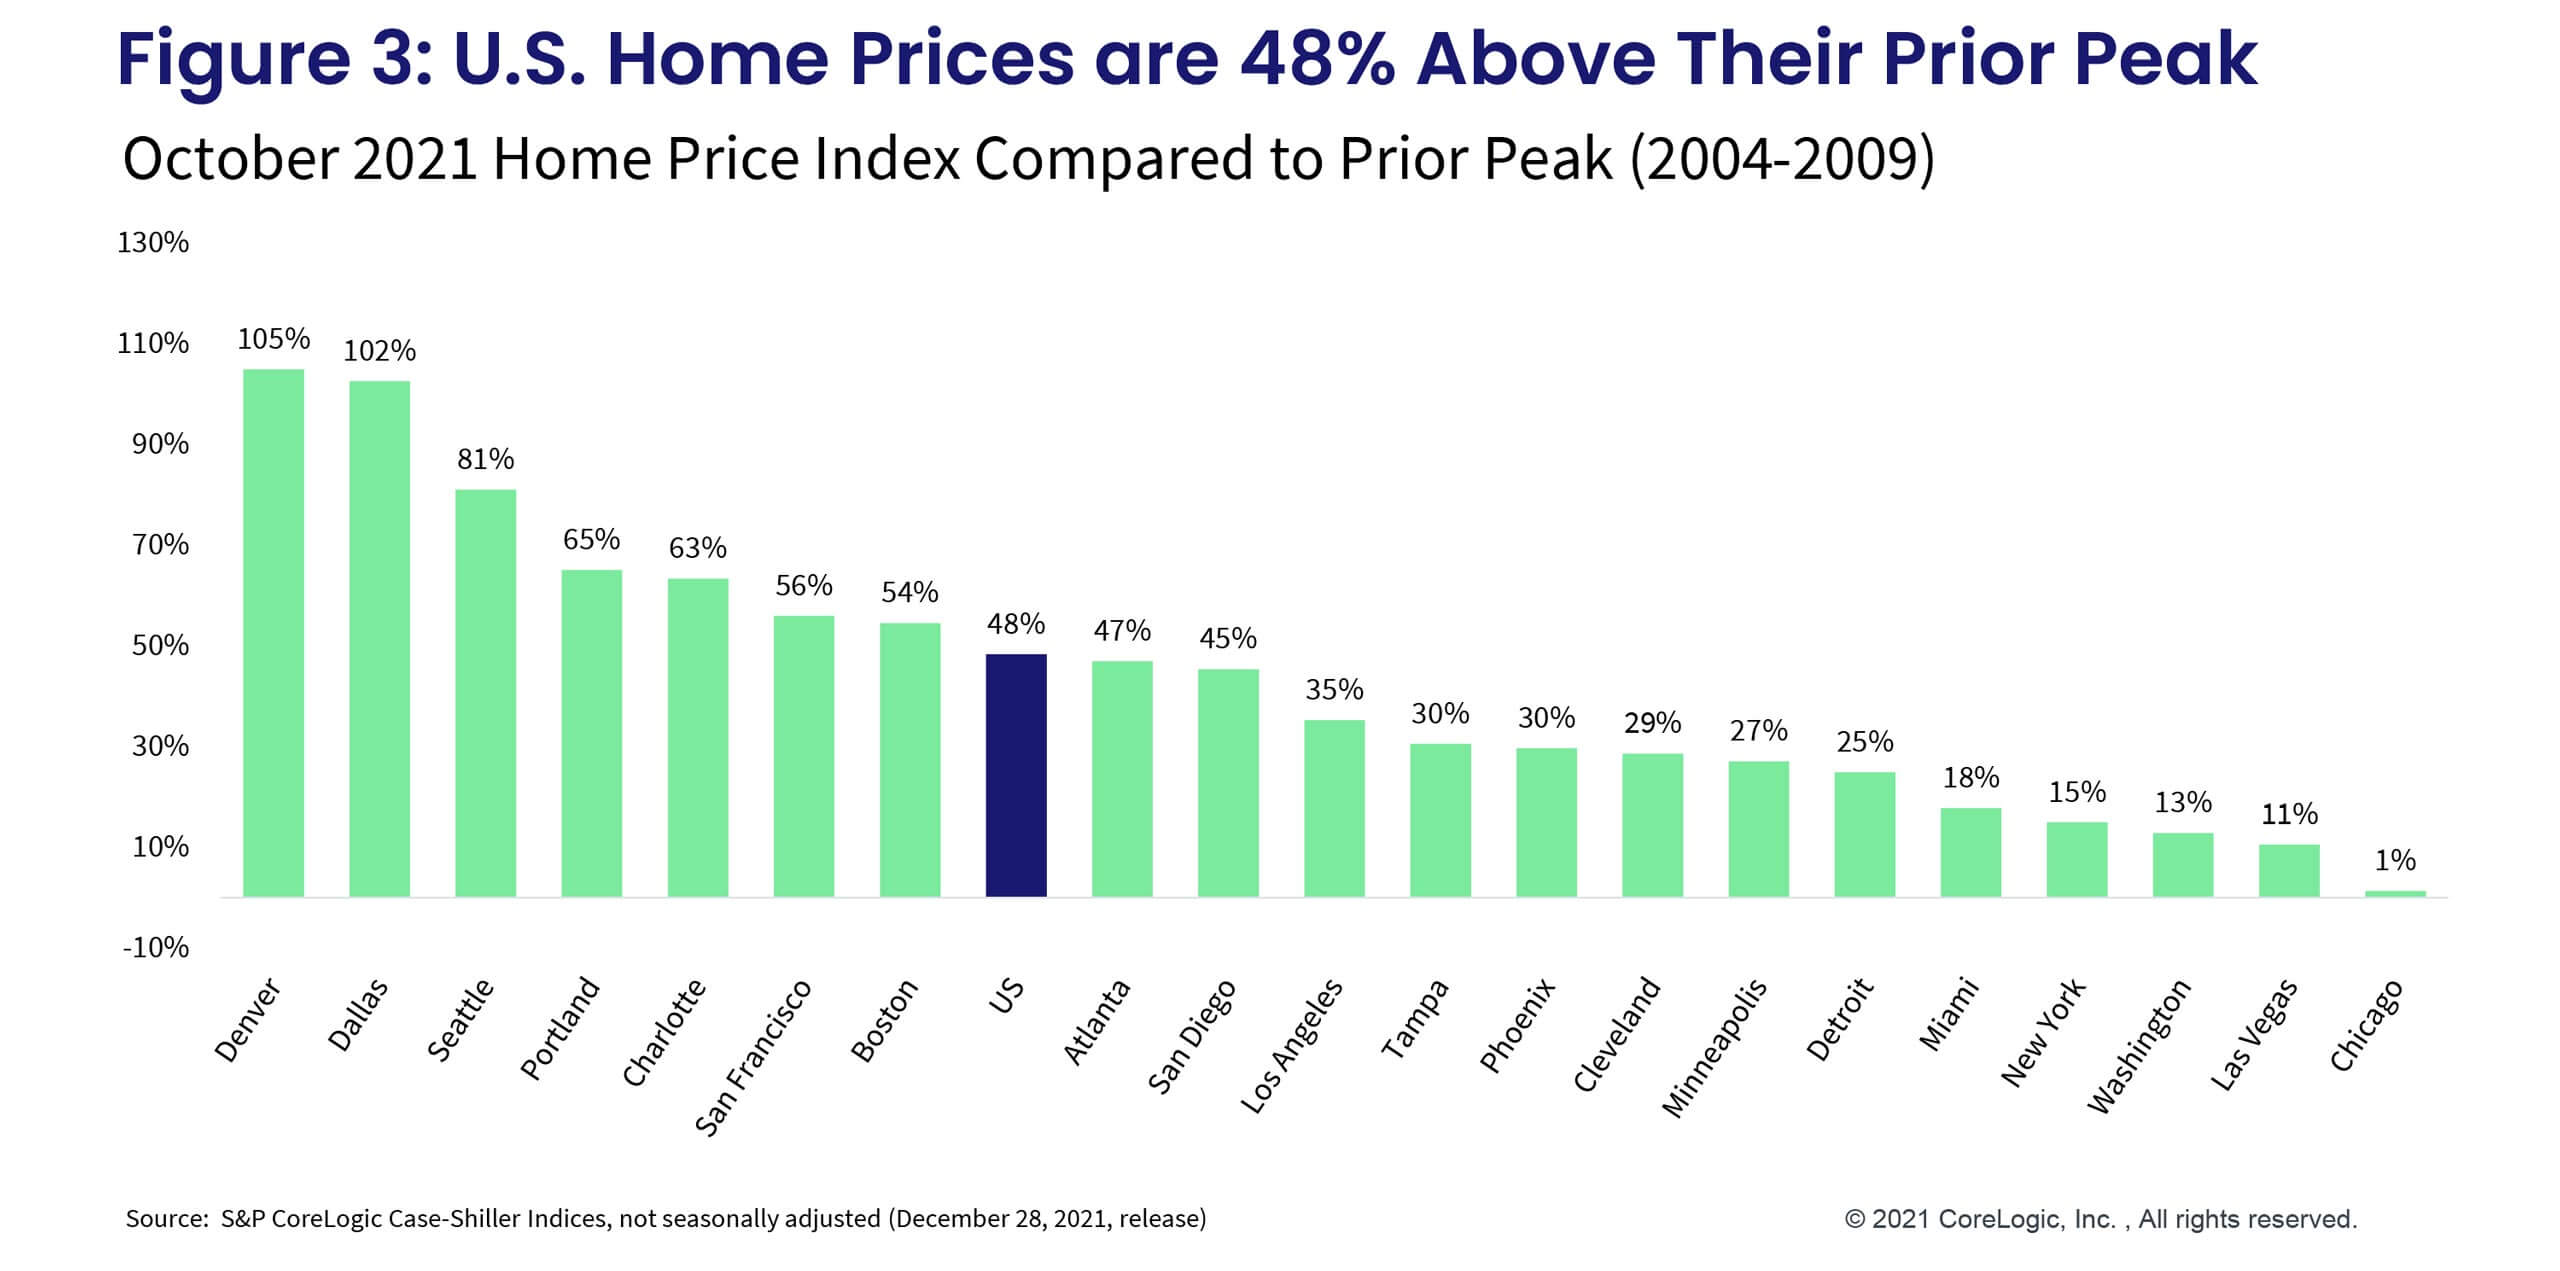
In October, national home prices were 48% higher than the previous peak. All metros are now at or above their previous peaks, though Chicago remains up only 1%, while Denver’s prices are 105% above its 2006 peak, followed by Dallas at 102% (Figure 3). Nonetheless, while nominal prices have surpassed previous levels, national home prices are only 11% above the previous peak when adjusted for inflation. Inflation growth in the second half of 2021 led to slowing of real price increase in recent months.
Further, while low- and high-tier home price growth remain very close, both tiers also experienced continued declines in October compared to the July peak, up 19.9% and 20%, respectively. The middle tier, however, logged a somewhat smaller, 18.8% year-over-year increase, also slower than the previous month. Prior to the pandemic, low-tier price growth was generally accelerating at a faster rate than the high tier. The slowdown in October’s annual gains was larger for the low and middle tiers leaving the high tier with the largest annual gains for the second consecutive month.
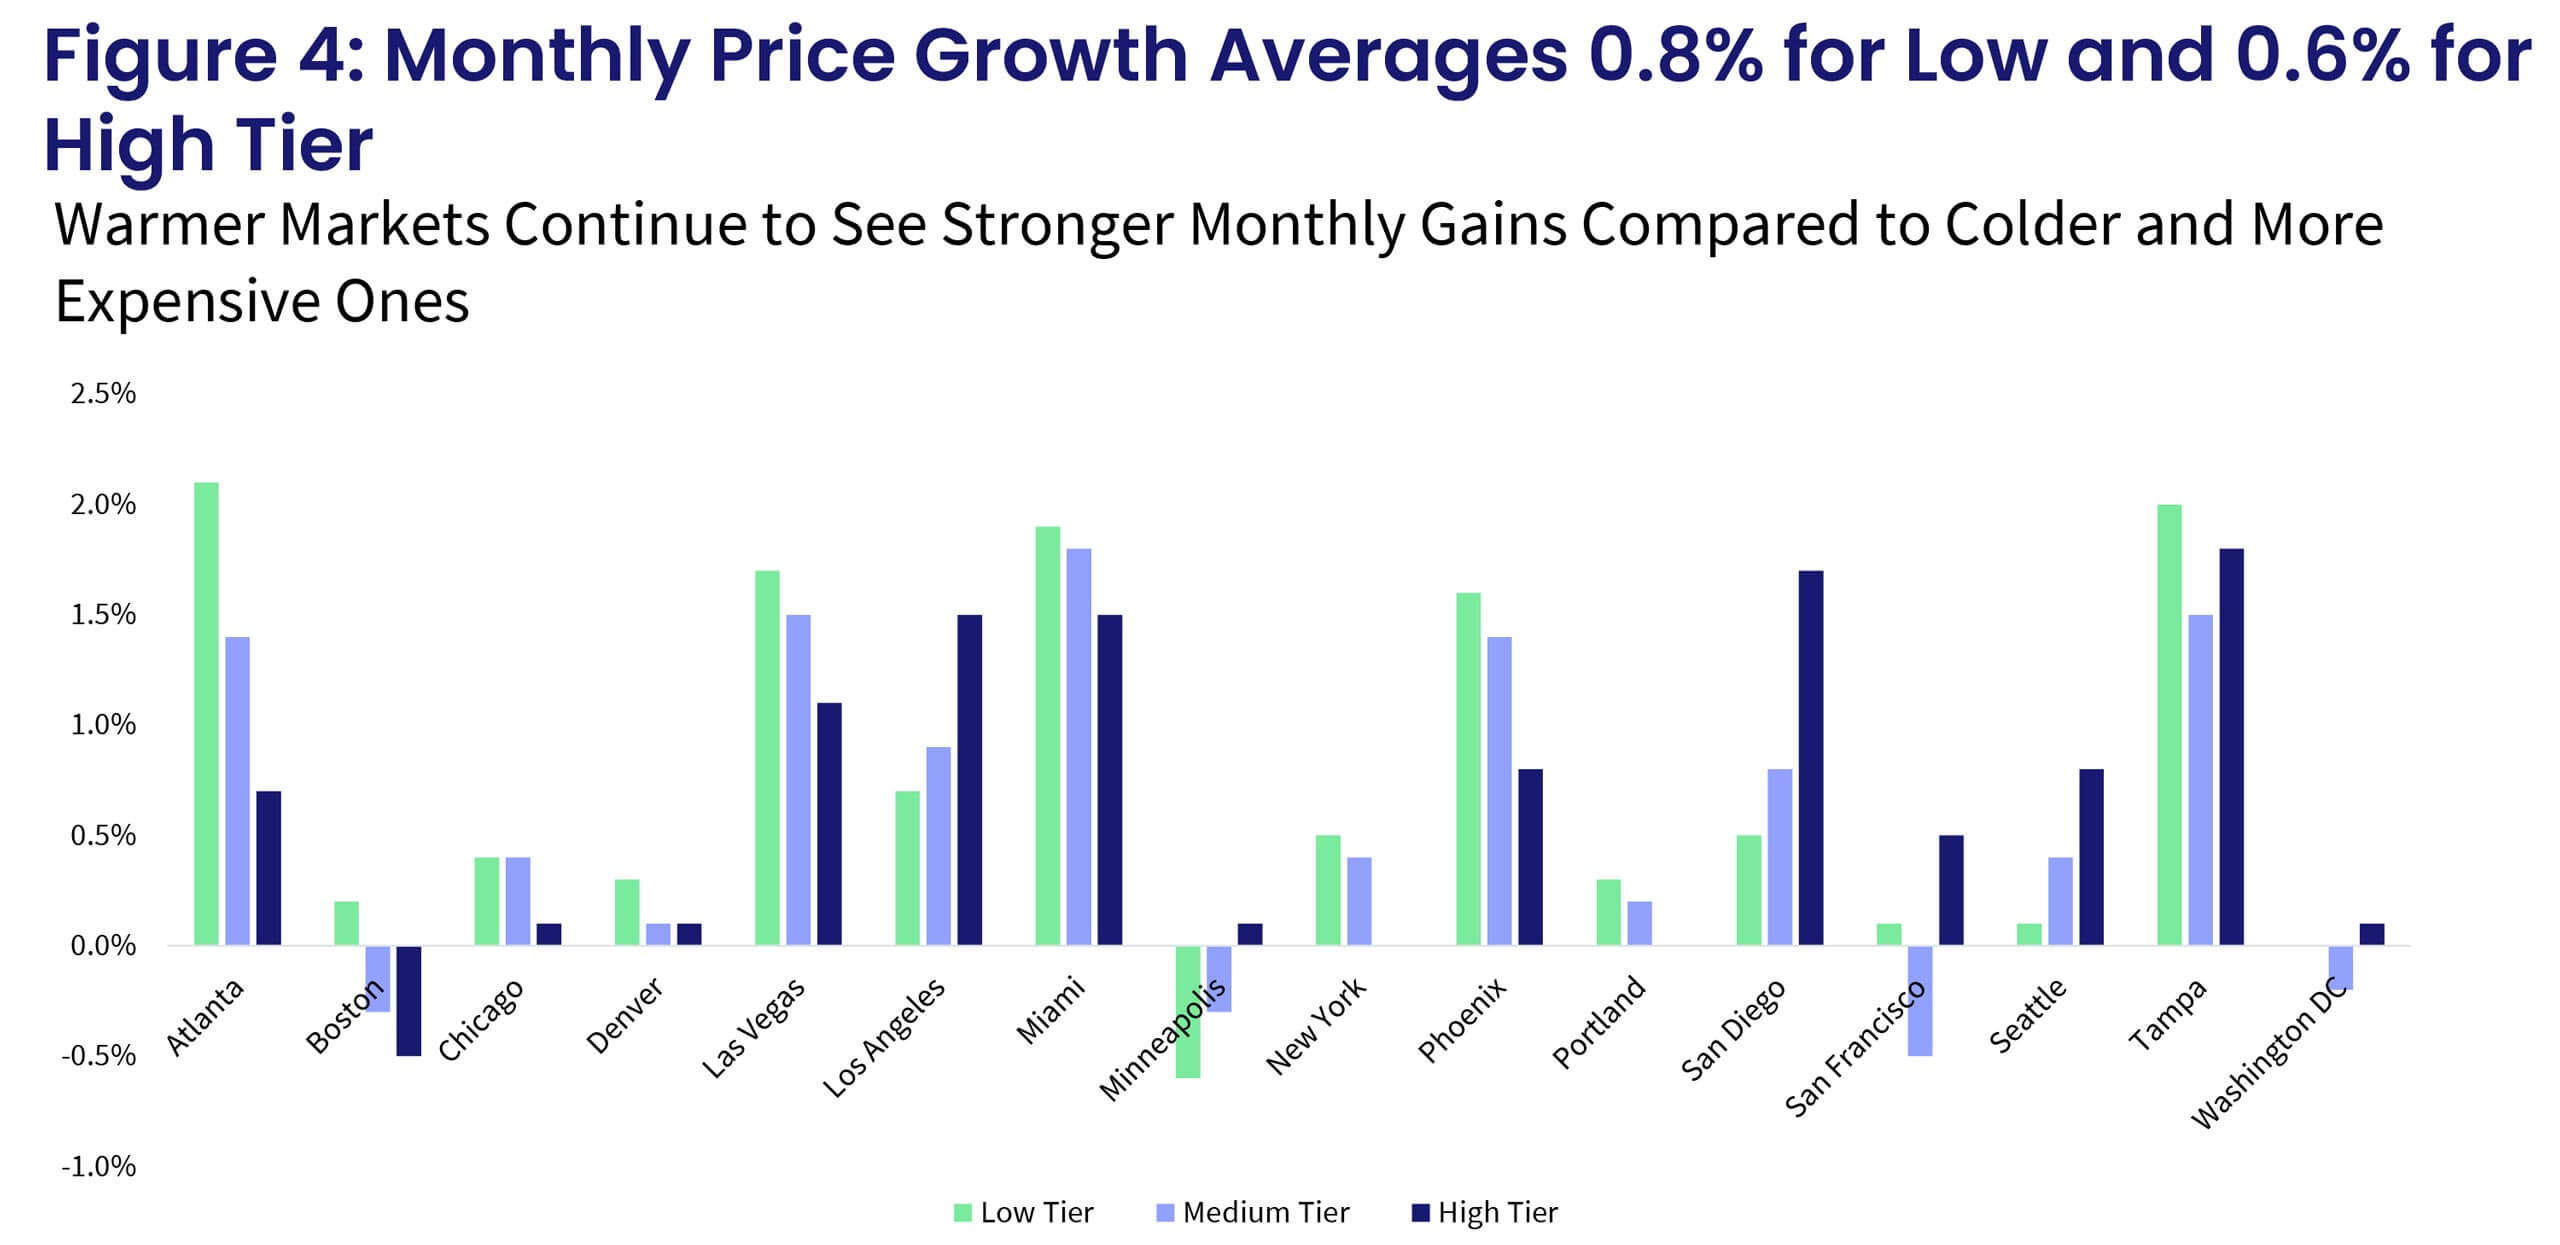
Moreover, the month-to-month comparison of home price growth by price tier and location reveals where demand is slowing relatively faster.
From September to October, the largest home price increase in the lower one-third price tier was in Atlanta, up 2.1%, followed by Tampa, up 2.0%. Only Minneapolis had a monthly decline in the low tier in October, down 0.6%. The average monthly gains among low-tier homes have slowed from the peak, dropping from 2.2% in June to 0.8% in October, though these are not seasonally adjusted.
In the high tier, Tampa led the monthly gains, up 1.8%, followed by San Diego, up 1.7%. Interestingly, high tier monthly gains in San Diego reaccelerated again after couple weaker months.
Average monthly gains in the high tier also slowed in October, up 0.6% compared to June’s 2.4% monthly average. More markets (four out of 20), seem to have monthly declines in the middle tier than in the low and high tier, where only one out of 20 markets had a decline in monthly gains (Figure 5).
As we close 2021, housing market indicators, including S&P CoreLogic Case-Shiller Index, suggest that the housing market will have another strong year in 2022. While the expected slowing of home price growth suggests overall annual appreciation in 2022 will fall shorter than that of 2021, the annual average of 7% is still higher than the average 5% seen between 2010 and 2020. Similarly, sales activity is likely to perk up as homeowners start moving again and more homes are built, bringing the projected total home sales to over 7 million — the highest level since 2006.


