


—US single-family rent prices increased 2.9 percent year over year in February 2019—
- Phoenix had the highest year-over-year rent price increase at 8 percent
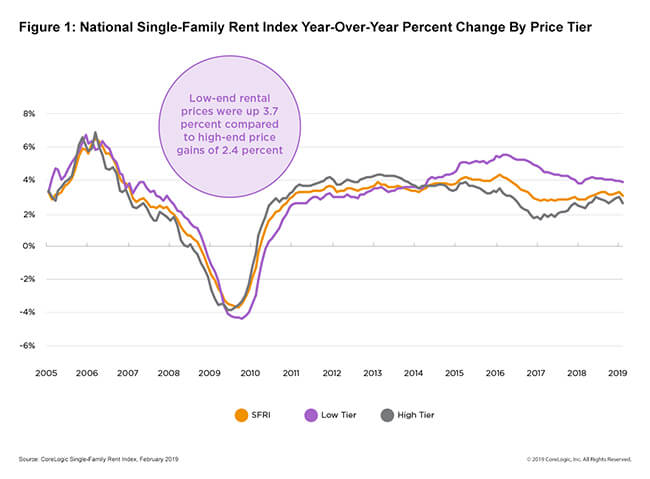
- Low-end rent prices were up 3.7 percent, compared to high-end price gains of 2.4 percent
CoreLogic® (NYSE: CLGX), a leading global property information, analytics and data-enabled solutions provider, today released its latest Single-Family Rent Index (SFRI), which analyzes single-family rent price changes nationally and among 20 metropolitan areas. Data collected for February 2019 shows a national rent increase of 2.9 percent, compared to 2.7 percent in February 2018.
Low rental home inventory, relative to demand, fuels the growth of single-family rent prices. The SFRI shows single-family rent prices have climbed between 2010 and 2019. However, overall year-over-year rent price increases have slowed since February 2016, when they peaked at 4.1 percent, and have stabilized over the last year with a monthly average of 3 percent.
National rent growth continued to be propped up by low-end rentals in February. Rent prices among this tier, defined as properties with rent prices less than 75 percent of the regional median, increased 3.7 percent year over year in February 2019, up slightly from the 3.6 percent increase experienced in February 2018. Meanwhile, high-end rentals, defined as properties with rent prices greater than 125 percent of a region’s median rent, increased 2.4 percent in February 2019, up from 2.3 percent in February 2018.
Among the 20 metro areas shown in Table 1, Phoenix had the highest year-over-year increase in single-family rents in February 2019 at 8 percent (compared to February 2018), followed by Las Vegas at 7.1 percent. Tucson, Arizona had the third highest year-over-year rent increase at 6.5 percent. And, for the first time in more than a year, Miami experienced the lowest rent increases of all analyzed metros at 1.2 percent.
Metro areas with limited new construction, low rental vacancies and strong local economies that attract new employees tend to have stronger rent growth. Phoenix and Orlando, Florida experienced high year-over-year rent growth in February, driven by employment growth of 3.1 percent and 3.9 percent year over year, respectively. These compare with the national employment growth average of 1.7 percent, according to data from the United States Bureau of Labor Statistics.
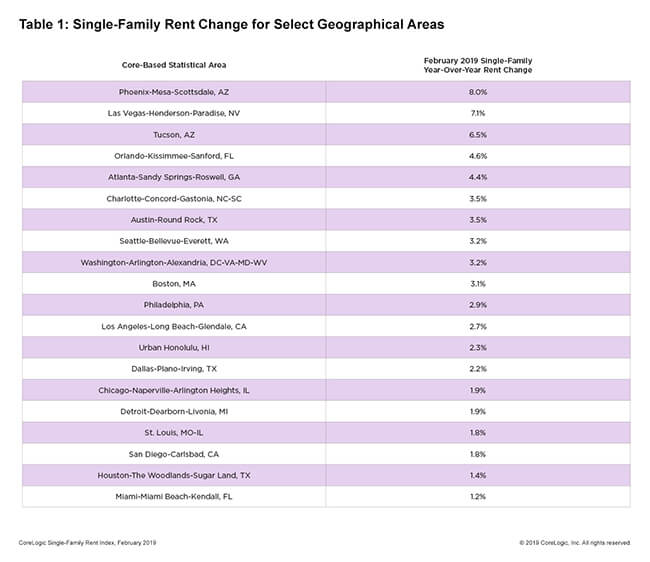
“As with the for-sale market, supply of single-family rentals saw very low levels in February, putting upward pressure on the cost of both for-sale and for-rent homes,” said Molly Boesel, principal economist at CoreLogic. “Phoenix had rapid rent increases in February with only 1.9 months of single-family rentals available. On the other hand, Miami, which had the slowest rent increases, had 7.6 months of single-family rentals available.”
Methodology
The single-family rental market accounts for half of the rental housing stock, yet unlike the multifamily market, which has many different sources of rent data, there are minimal quality adjusted single-family rent transaction data. The CoreLogic Single-Family Rent Index (SFRI) serves to fill that void by applying a repeat pairing methodology to single-family rental listing data in the Multiple Listing Service. CoreLogic constructed the SFRI for over 80 Core Based Statistical Areas (CBSAs)—including 45 CBSAs with four value tiers—and a national composite index.
Source: CoreLogic
The data provided is for use only by the primary recipient or the primary recipient’s publication or broadcast. This data may not be re-sold, republished or licensed to any other source, including publications and sources owned by the primary recipient’s parent company without prior written permission from CoreLogic. Any CoreLogic data used for publication or broadcast, in whole or in part, must be sourced as coming from CoreLogic, a data and analytics company. For use with broadcast or web content, the citation must directly accompany first reference of the data. If the data is illustrated with maps, charts, graphs or other visual elements, the CoreLogic logo must be included on screen or website. For questions, analysis or interpretation of the data, contact Alyson Austin at [email protected] or Allyse Sanchez at [email protected]. Data provided may not be modified without the prior written permission of CoreLogic. Do not use the data in any unlawful manner. This data is compiled from public records, contributory databases and proprietary analytics, and its accuracy is dependent upon these sources.
About CoreLogic
CoreLogic (NYSE: CLGX) is a leading global property information, analytics and data-enabled solutions provider. The company’s combined data from public, contributory and proprietary sources includes over 4.5 billion records spanning more than 50 years and providing detailed coverage of property, mortgages and other encumbrances, consumer credit, tenancy, location, hazard risk and related performance information. The markets CoreLogic serves include real estate and mortgage finance, insurance, capital markets, and the public sector. CoreLogic delivers value to clients through unique data, analytics, workflow technology, advisory and managed services. Clients rely on CoreLogic to help identify and manage growth opportunities, improve performance and mitigate risk. Headquartered in Irvine, Calif., CoreLogic operates in North America, Western Europe and Asia Pacific. For more information, please visit www.corelogic.com.
CORELOGIC and the CoreLogic logo are trademarks of CoreLogic, Inc. and/or its subsidiaries.