When it comes to expansion possibilities for property investors and retail stores, often a map of the United States seems like a dart board onto which development decisions are pinned using imprecise aim. Much like hitting a bullseye, sometimes this technique works out better than others.
But what if locations for development projects could be strategically selected for their surefire, replicable success? That’s where machine learning on CoreLogic’s Discovery Platform comes in handy.
Discover the Power of Data
While offerings like Neighborhood Scout allow you to dig into hyperlocal data on over 600 community characteristics, including school performance, neighborhood-specific crime and real estate trends to understand communities and build neighborhood profiles, machine learning algorithms can be applied to identify patterns and group similar neighborhoods. When these two capabilities are merged using CoreLogic’s Discovery Platform, suddenly decisions on where to invest can be made with confidence – again and again and again.
Answer Big Business Questions with Cloud-Based Data and Property Analytics
In the example below, we use census tract-level data available through Neighborhood Scout in conjunction with unsupervised machine learning algorithms such as k-means and hierarchical clustering.
Using this analysis, we found that neighborhoods with similar characteristics to the initial neighborhood of interest are grouped or clustered together based on algorithms that are mathematically similar. The functionality presented below draws on, but is not identical to, techniques used within the Neighborhood Scout Match and tools found on NeighborhoodScout.com.
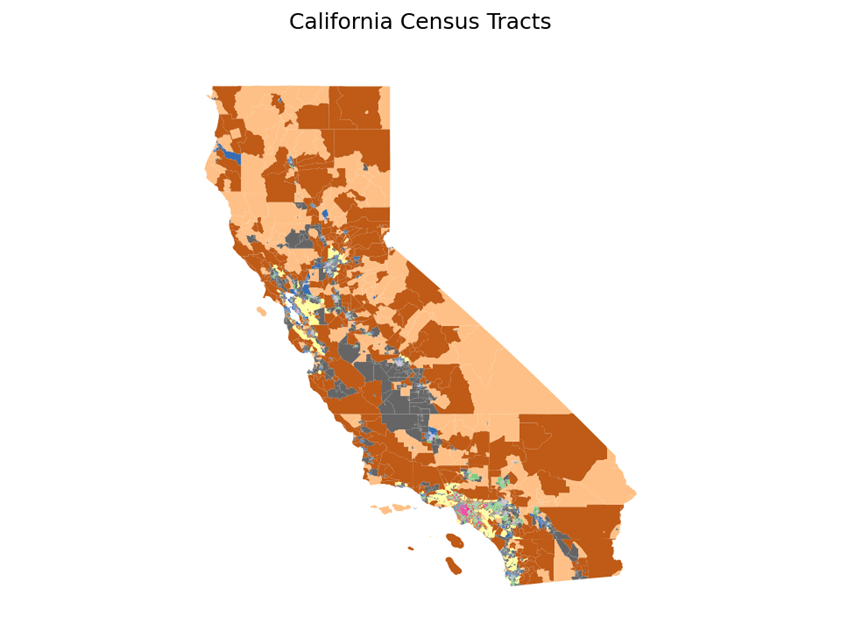
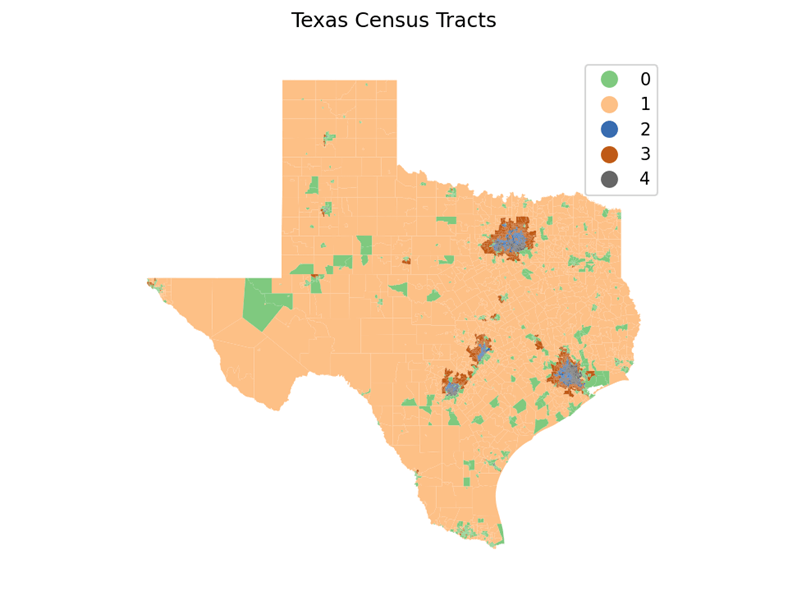
The map below uses 2020 census geometry to show neighborhood clusters at a census tract level for both California and Texas. Based on a proprietary similarity score, the machine learning model generated the 10 different clusters shown below. These clusters present similar physical, social and economic area characteristics such as housing type, housing density, population demographics, income levels, education levels and local economies.
Figure 1: Census Tracts in California and Texas


Using a similar method, we can build neighborhood clusters at the census tract level to compare a single census tract to communities across the entire nation. Figure 2 demonstrates that application.
Figure 2: Similar Census Tracts

CoreLogic’s Discovery Platform contains both the census tract input data as well as the technical code to replicate and extend the analysis above.
If you are already using Discovery Platform, contact your account manager to get access to a notebook as well as tips on how to run additional analyses. If you’re not yet on the fast track to getting the bigger picture, find out more about CoreLogic’s Discovery Platform today.