CoreLogic Climate Risk Analytics: Composite Risk Score analyzes natural hazard risk at a property level
By: Kent David, Science & Analytics, CoreLogic
Natural catastrophes such as hurricanes, floods, wildfires, earthquakes, severe convective (thunder) storms and winter storms are headline occurrences due to their dramatic, damaging effects on communities. While headlines frequently focus on these disasters, lost in this spotlight are the equally important questions about the areas sheltered from such catastrophes.
Investigations of these untouched areas are key to confronting the impacts of natural catastrophes — we can learn as much from what went right as we can from what went wrong.
Although historical events give us some indication of where natural hazard risk may be high, evolving climate risk is changing these patterns, so a complete, forward-looking analysis is needed to clearly identify where natural hazard risks are the lowest. CoreLogic’s Climate Risk Analytics: Composite Risk Score (CRA Composite Risk Score) solution can not only identify areas that are currently low risk, but it can also stress test those hazard risks across various future climate scenarios.
CoreLogic Data Outlines a Geographical Safety Net
The impact of significant natural hazard events on a property is a function of location and the characteristics of the property subject to the event. To consider both variables, CoreLogic developed its analytics capabilities on top of its extensive property datasets that provide a deep and broad insight into natural hazards, climate risk and their resultant impacts on the built environment.
To exemplify CoreLogic’s CRA Composite Risk Scores, this study focuses on demonstrating the risk to the highest-value asset class in the U.S.: single-family structures, an industry that gained $2.2 trillion in the third quarter of 2022 to approach $46 trillion, according to CoreLogic’s Office of the Chief Economist.
These analytic solutions provide the ideal means to determine the “best places to live” from a natural hazard point of view. The CoreLogic CRA Composite Risk Score, which demonstrates risk on a scale of 1 to 100, represents the sum of the Average Annual Loss (AAL) relative to the calculated Reconstruction Cost Value (RCV). These scores not only consider the impactful environmental risks to 154 million properties across the U.S., but they also incorporate CoreLogic’s distinct and comprehensive data describing the physical characteristics of those homes themselves, including year built, first-floor height, number of stories and square footage.
Research Safety Through Composite Risk Scores
The county-level CRA Composite Risk Scores were utilized for this study. These scores represent the reconstruction cost value-weighted Composite Risk Scores for the single-family residences within each county.
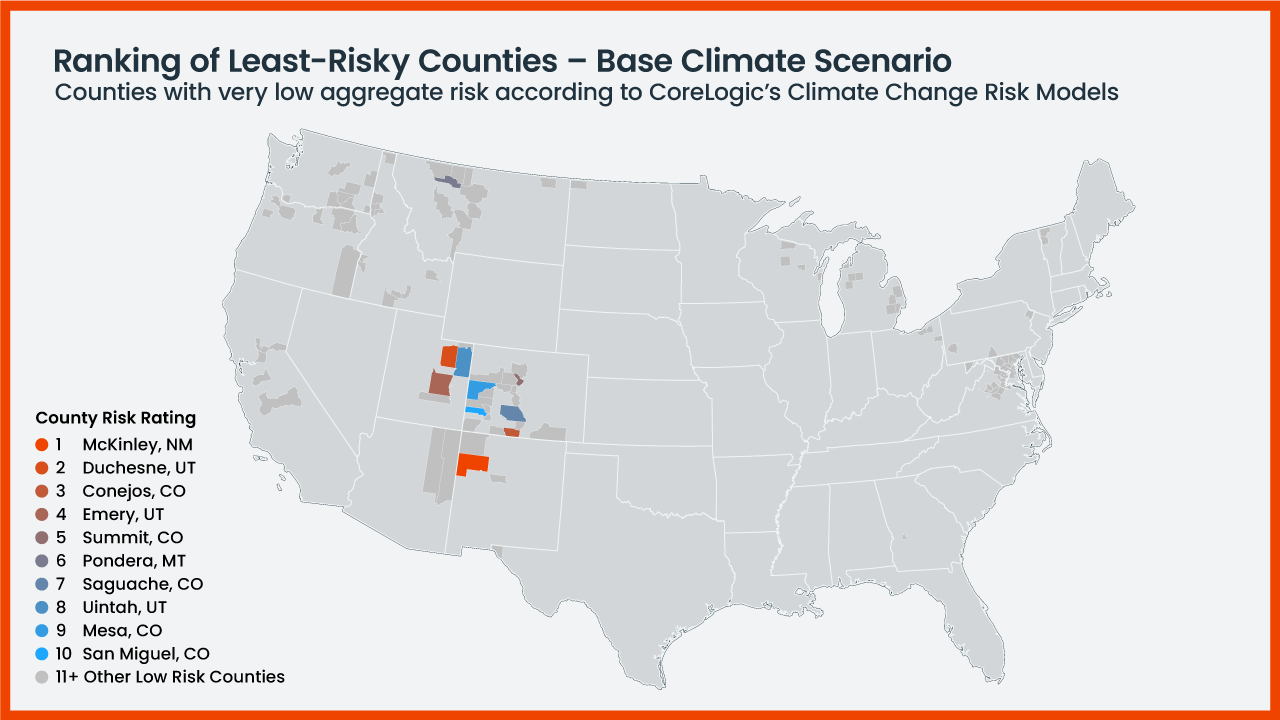
In the continental U.S., there are 124 counties that have a CRS of 1 (the lowest aggregate risk of natural hazards), but the top 10 list features counties with the lowest underlying AALs. Inherent to this discussion is the acknowledgment that there is significant variability in risk within any given county, both due to the nature of phenomena (e.g., hurricane sea surge risk decreases dramatically with elevation gain and distance from the coast; earthquake risk varies due to soil conditions and distance from the rupture) as well as the various characteristics of structures such as construction quality, year built, building type and number of stories. Figure 1 below maps all 124 counties with a CRS of 1 and highlights the ten least-risky counties in the continental United States as ranked by their AALs.

Located west of Santa Fe and Albuquerque, McKinley is a small county with a big claim to fame. Not only is it sheltered from the most significant impacts of hurricanes and earthquakes which drive higher risk elsewhere in the country, but its county seat, Gallup, is the famed inspiration for the eponymous Roy Rogers song and is a whistle-stop on Route 66. The perils driving risk in all the low-risk counties include thunderstorms, wildfires and flooding, but the risk of these perils to the built environment is dramatically lower than elsewhere in the country.
What Impacts Will Climate Change Have on the Least-Risky County List?
There are numerous impactful environmental changes linked to climate change, including mega-droughts — and the resulting wildfires — in the western United States and inland flooding associated with large, slow-moving hurricanes. Current climate projection models paint a variable picture of expected climate change impacts on the U.S. environment. Included in the study’s calculations, with respect to climate change, are the changing risk potentials from two perils associated with earthquakes: tsunami flooding and fire-following-earthquakes.
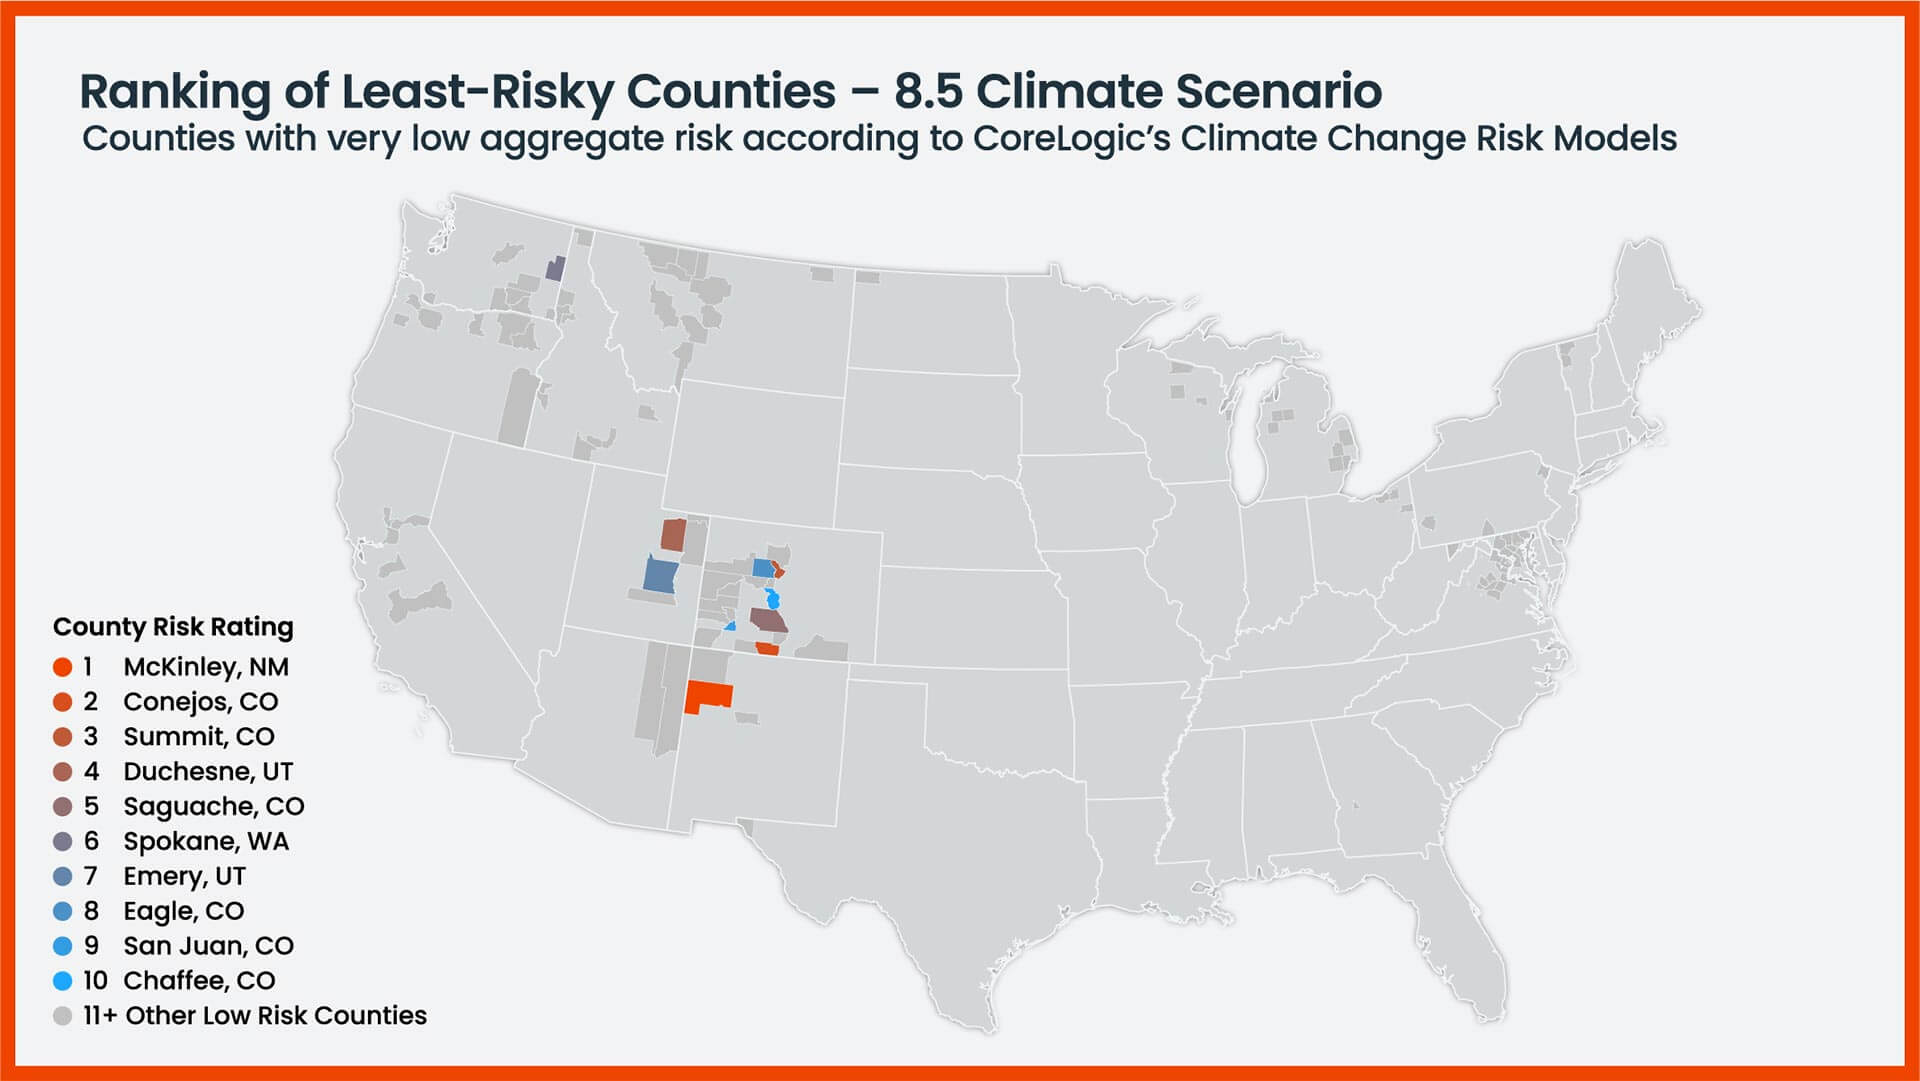
Using CoreLogic’s CRA Composite Risk Scores to forecast a climate change scenario to 2050 with a projection that assumes little to no effective reduction in greenhouse gas emissions, we have identified the top 10 least-risky counties in this future scenario.

| Rank (Least-Risky) | State | County | % Risk Increase from 2022 Climate Conditions |
| 1 | New Mexico | McKinley | 26% |
| 2 | Colorado | Conejos | 10% |
| 3 | Colorado | Summit | 11% |
| 4 | Utah | Duchesne | 38% |
| 5 | Colorado | Saguache | 19% |
| 6 | Washington | Spokane | 18% |
| 7 | Utah | Emery | 39% |
| 8 | Colorado | Eagle | 12% |
| 9 | Colorado | San Juan | 2% |
| 10 | Colorado | Chaffee | 21% |
Even when climate change is factored in, McKinley County remains the least-risky county in the study, but its risk is still projected to increase by 26%. This New Mexico county shares the top 10 future ranking with five other counties that make the top 10 list when climate change is not considered a factor.
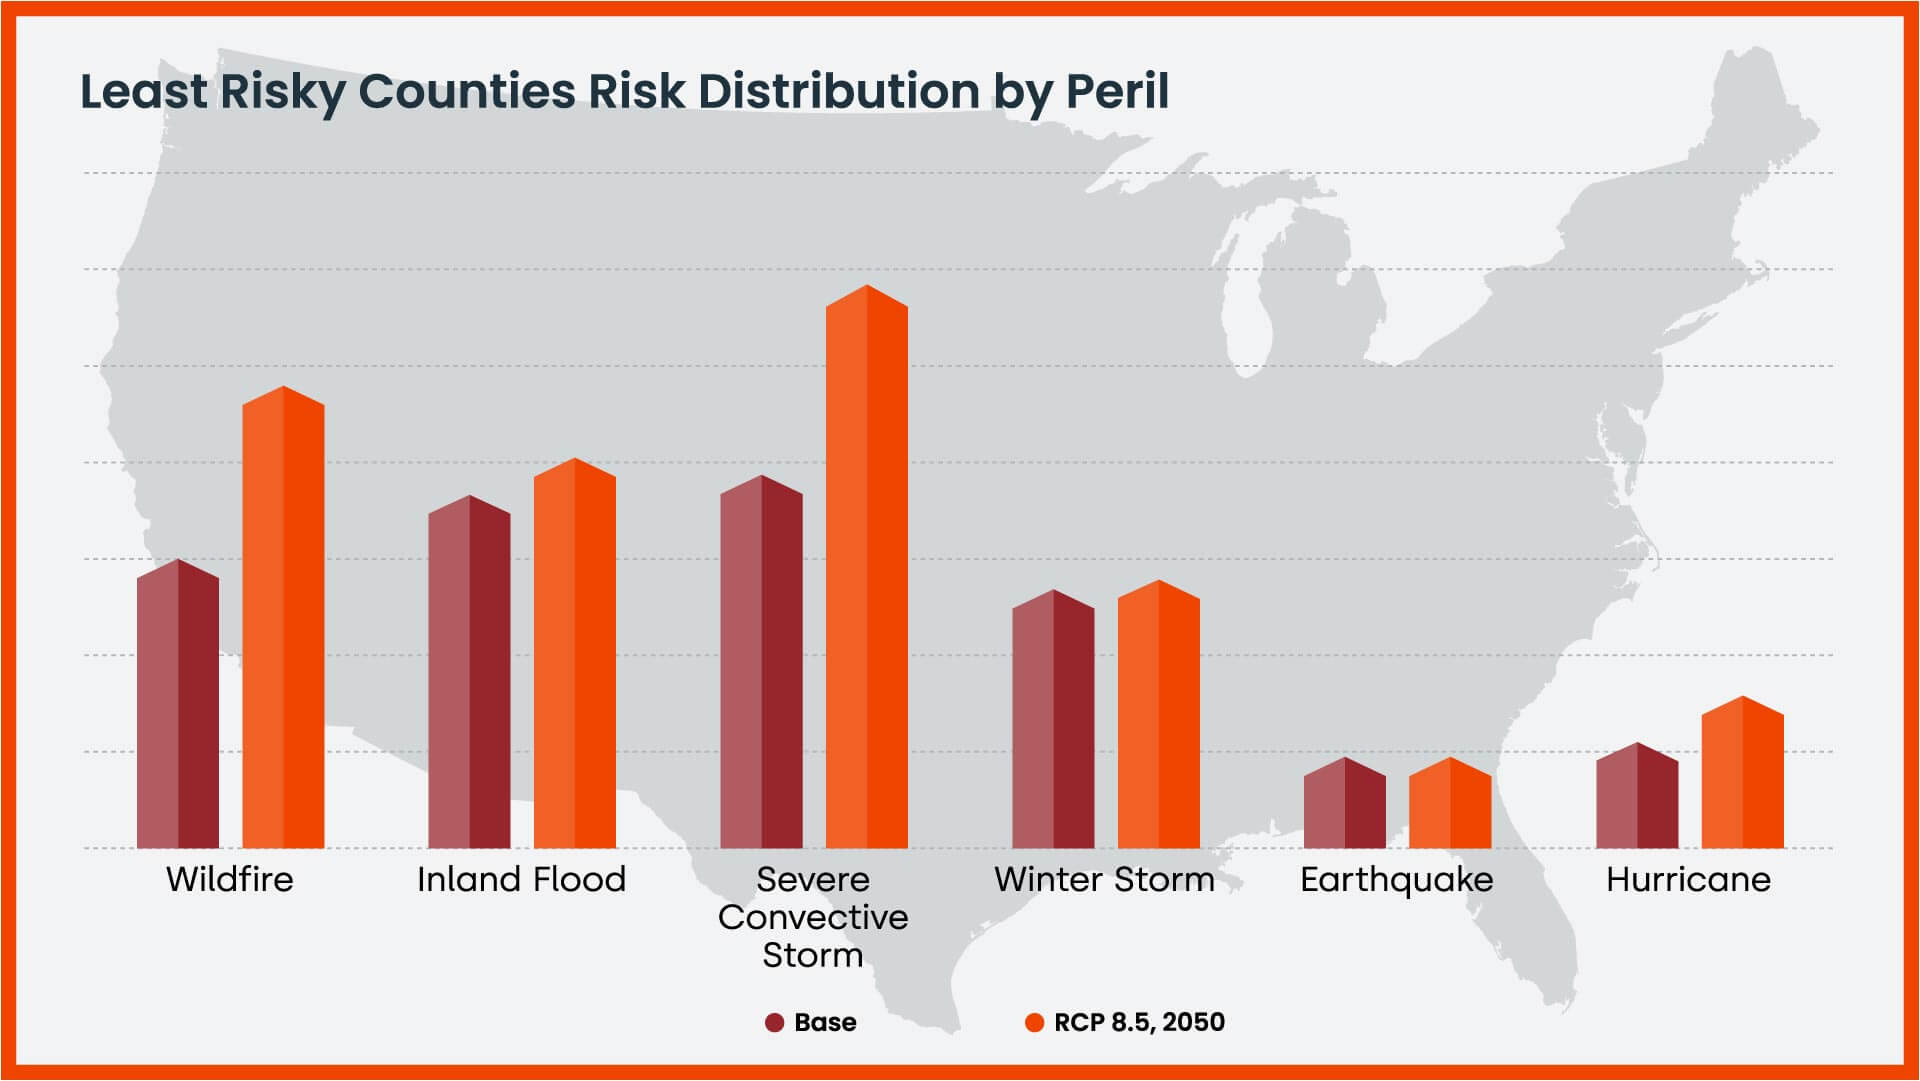
What drives this stability in the low-risk rankings is the fact that these counties have little exposure to hurricane risk and only moderate exposure to wildfire, inland flooding and severe convective storms. While these perils are projected to have an increasing impact on these communities in the projected climate change scenario, the risk remains low relative to the elevated risk projected for other regions.

As illustrated in Figure 3, there is rising risk in these low-risk counties from weather perils such as wildfires and severe convective storms in the studied climate change condition.
The changing climate is expected to dramatically alter the risks associated with hurricanes, wildfires and flooding nationwide. The fluctuating risk landscape resulting from climate change will not uniformly alter the risk landscape in the United States. However, in this changing climate, there are regions where the lack of current exposure to earthquakes and hurricanes, as well as the low risk from flooding, wildfires and severe convective storms, is strongly aligned with a low-risk future. While this study focused on low-risk areas, CoreLogic’s Climate Risk Analytics: Composite Risk Score tools are equally adept at identifying natural catastrophe risk on a parcel or regional basis, both for current climate conditions and future climate projections.
To help see the future a little more clearly, use CoreLogic’s CRA Composite Risk Scores to model comparisons between current and future climate scenarios on a regional and local scale.